A Practical Look At Selecting Price Ranges
A quick glance of the price range considerations covered in the first half of this series highlights the actual complexity hiding behind such a simple choice. To help bring these concepts to life, this article tracks 3 positions of varying ranges across 4 pools with different characteristics. The observed APRs are then linked back to the concepts which were covered previously. These 12 positions were monitored over the course of a week (26/06/23 – 02/07/23) to provide an overview as to how market movements affect LP APRs.
Note that pool and chain specific factors will not be covered here so as to focus on the relationship between token and position specific factors. Each of the 3 positions will be created on the same pool on Polygon hence the effects of fee tiers and underlying chains will be negated. To simplify further, we will assume WBTC and WETH are representative of BTC and ETH as a whole and therefore multi-chain liquidity considerations are not considered. These concepts will be covered in a separate article as the complexities are deserving of a deeper look into its effects on APRs.
For the purposes of this article, we will create a narrow, medium, and wide range position on 4 different pools with different risk profiles: USDC-USDT, WETH-USDC, WBTC-WETH, KNC-AAVE. For consistency, the definition of the range width is based on the tick spacing of 3, 7, and 15 respectively with the center tick of each range being the active tick. Tick spacing determines the granularity of the price “buckets” which a LP can contribute liquidity to. The motivation behind each pool choice as well as the results are covered in the individual sections.
- Part 1: Why narrower ranges result in higher APRs but greater risks?
- Part 2: A practical look at selecting the best ranges
For LPs that are looking to maximize their potential returns, all the learnings have been condensed into a simple flow diagram which walks you through each of the key decision points when determining the best risk-adjusted position range.

View and interact with the full diagram in greater detail here.
Low Risk: USDC-USDT
Minimal risk as market making is carried out between two of the largest stablecoins which are pegged to the same value reference (i.e. the US dollar). LPs are not exposed to the price movements of crypto-specific tokens.
Token Specific Factors
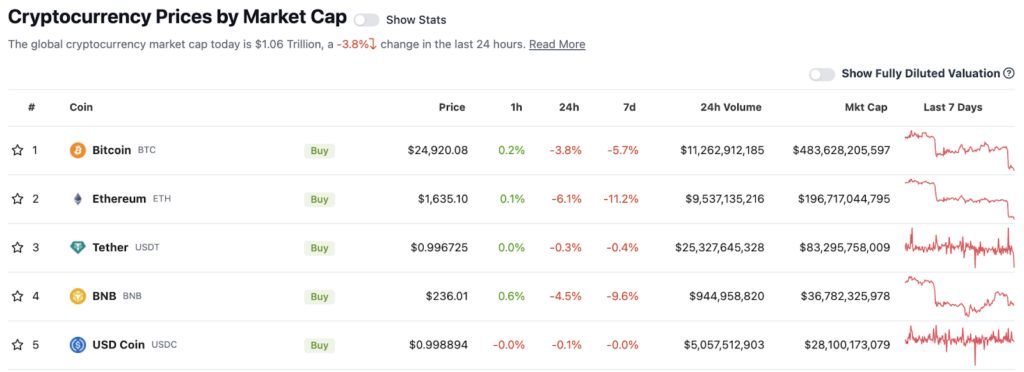
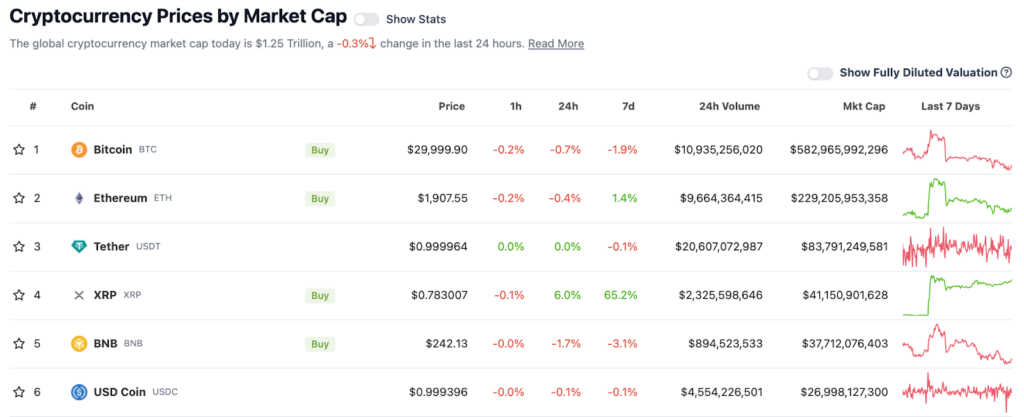
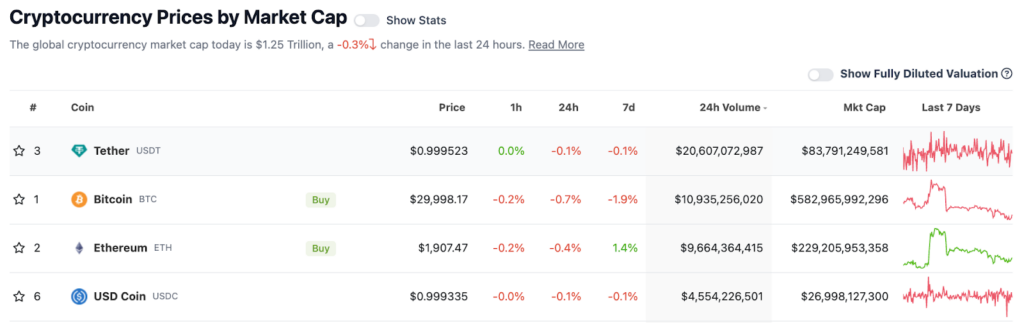
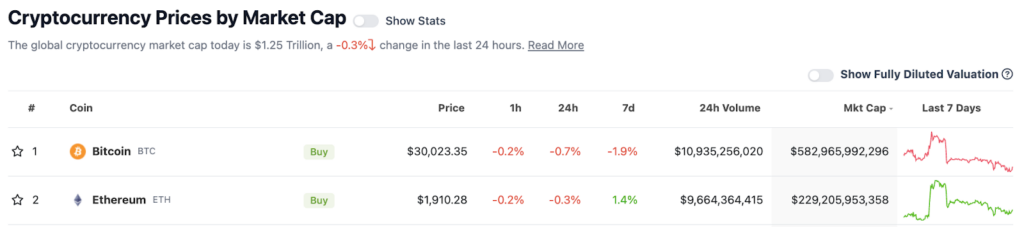
- Token market capitalization: Both tokens are amongst the largest cryptocurrencies by market capitalization
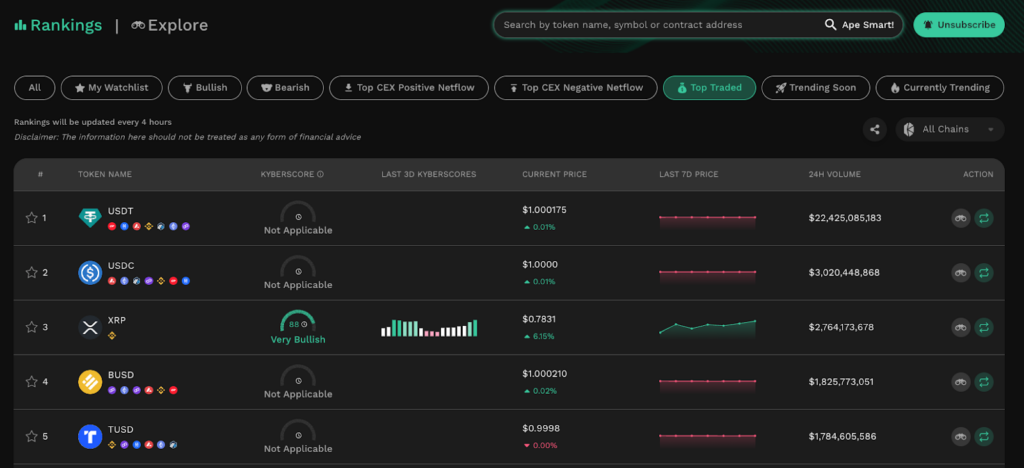
- Constant token trade volume: USDC and USDT are consistently the top 2 tokens traded by volume.
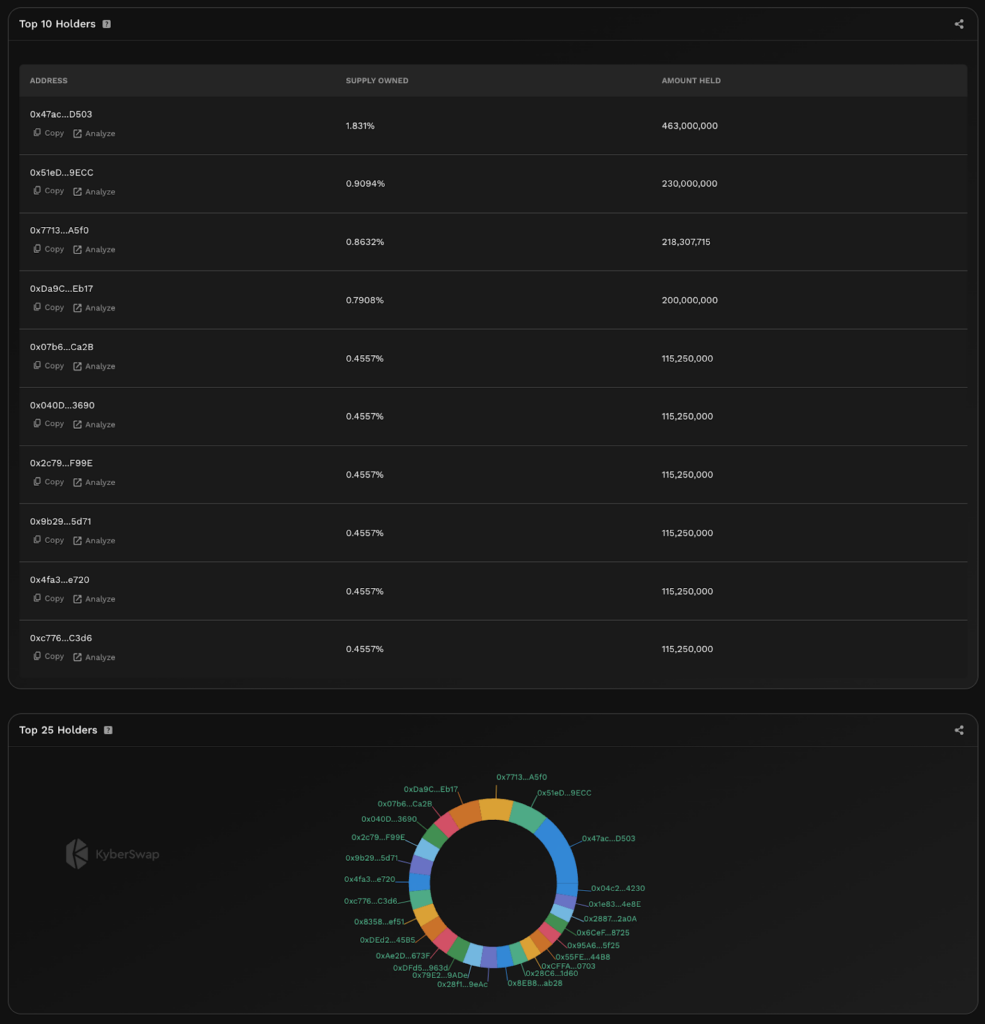
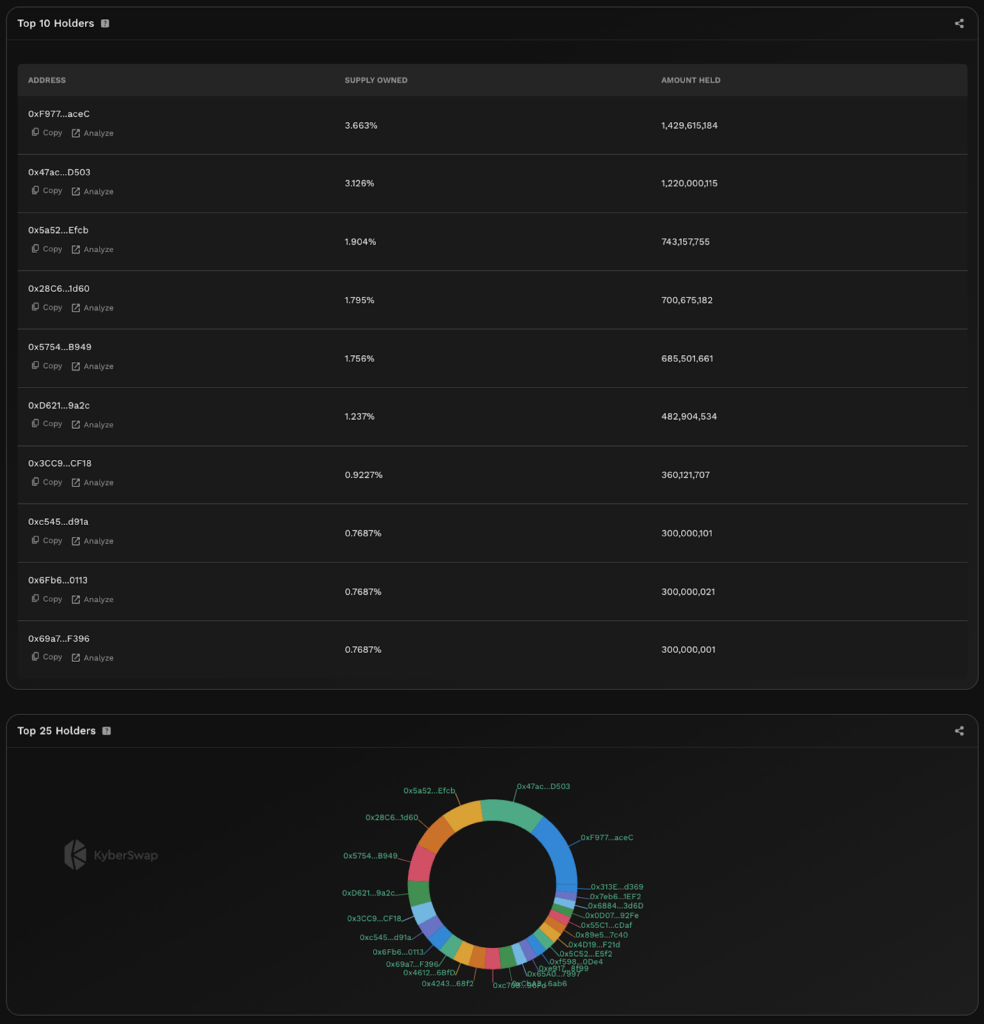
- Token distribution: Both USDC and USDT are widely distributed with an extremely high circulating supply to total supply ratio.
- Token correlation: Both tokens are pegged to the US dollar and are collateralized based on fiat equivalents. Barring any black swan events, deviations are expected to be non-existent.
Positions Created
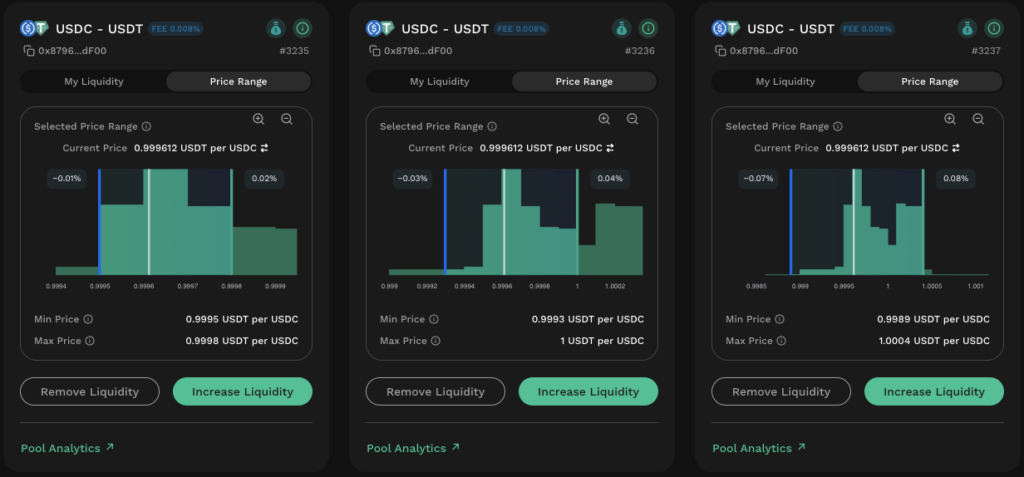
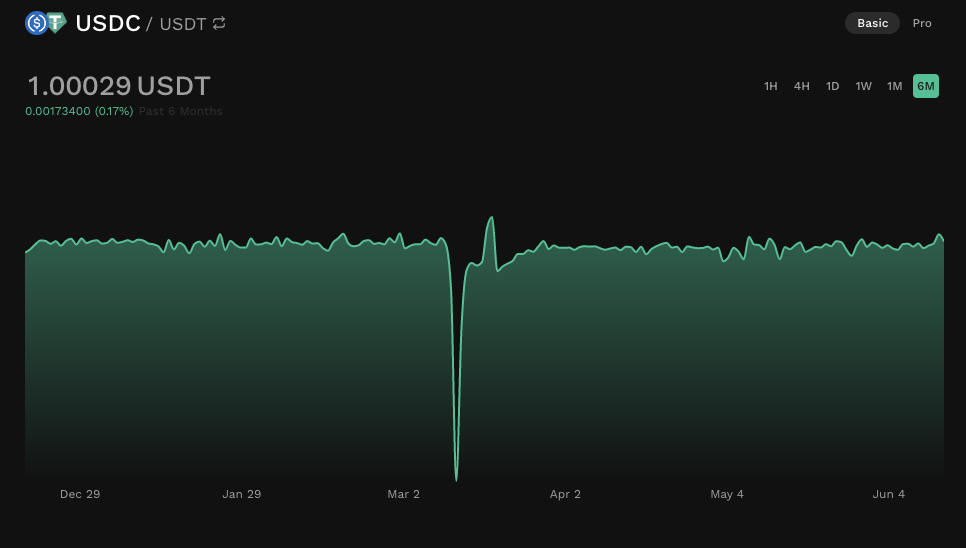
3 positions were created at the market price of 0.999612USDT:1USDC.
| Position | Min Price | Max Price | Min Price % Deviation | Max Price % Deviation |
| Narrow | 0.9995 | 0.9998 | 0.01 | 0.02 |
| Medium | 0.9993 | 1 | 0.03 | 0.04 |
| Wide | 0.9989 | 1.0004 | 0.07 | 0.08 |
Results
[smartslider3 slider=”2″]
Narrow Range (3 Ticks)
| Day | 0 | 1 | 2 | 3 | 4 | 5 | 6 | 7 |
| My Liquidity Balance (USD) | 20 | 20.02 | 20.08 | 20 | 20.02 | 20.02 | 20.02 | 20.06 |
| My Pool APR (%) | 0 | 1.79 | 0.9 | 0.6 | 0.44 | 0.35 | 0.28 | 0.25 |
| My Pooled USDC | 12.4156 | 0 | 0 | 0 | 0 | 0 | 0 | 0 |
| My Pooled USDT | 7.60802 | 20.0199 | 20.0199 | 20.0199 | 20.0199 | 20.0199 | 20.0199 | 20.0199 |
Medium Range (7 Ticks)
| Day | 0 | 1 | 2 | 3 | 4 | 5 | 6 | 7 |
| My Liquidity Balance (USD) | 20 | 20.04 | 20.08 | 20.01 | 20.03 | 20.03 | 20.02 | 20.07 |
| My Pool APR (%) | 0 | 1.29 | 0.97 | 0.88 | 0.65 | 0.51 | 0.42 | 0.37 |
| My Pooled USDC | 11.0466 | 3.80285 | 2.58457 | 0 | 0 | 0 | 0 | 0 |
| My Pooled USDT | 8.98344 | 16.2253 | 17.4435 | 20.0279 | 20.0279 | 20.0279 | 20.0279 | 20.0279 |
Wide Range (15 Ticks)
| Day | 0 | 1 | 2 | 3 | 4 | 5 | 6 | 7 |
| My Liquidity Balance (USD) | 20 | 20.05 | 20.06 | 20.01 | 20.02 | 20.02 | 20.02 | 20.06 |
| My Pool APR (%) | 0 | 0.6 | 0.45 | 0.43 | 0.41 | 0.59 | 0.55 | 0.52 |
| My Pooled USDC | 10.4951 | 7.11505 | 13.4781 | 15.2145 | 3.94915 | 0.898826 | 3.57131 | 4.39153 |
| My Pooled USDT | 9.53051 | 12.9097 | 6.54658 | 4.81008 | 16.0755 | 19.1265 | 16.4534 | 15.6331 |
Price Movement
| Day | 0 | 1 | 2 | 3 | 4 | 5 | 6 | 7 |
| USDT per USDC Price | 0.9996 | 0.999867 | 0.99991 | 1.00004 | 1.0001 | 1.00033 | 1.00013 | 1.00007 |
| % Change From Previous Day | – | 0.03% | 0.00% | 0.01% | 0.01% | 0.02% | -0.02% | -0.01% |
Observations
Only the wide range position remained active throughout the period of observation. The narrow range position went out of range on the first day with the medium range position following suit on day 3. Once the market price exceeded the max price of the narrow and middle range positions, it never dipped back below the respective max prices as it continued to trade in the higher ranges for the rest of the week. Consequently, the wide range position had the best APR amongst the 3 positions.
Based on the first day when all positions were in range, it can be observed that the narrow range APR was significantly higher as it received a larger portion of the trading fees. The capital efficiency of the medium and narrow position ranges were approximately 2 and 3 times more effective than the wider range position. Nonetheless, with both medium and narrow position ranges going out-of-range for the majority of the week, their overall APR for the week was significantly hampered. These results highlight the fact that without active management, narrower range positions which spend the majority of time out-of-range will significantly underperform wider range positions which continue to stay “in-the-money”.
Regardless of the position’s range, notice that the APRs across all positions were relatively low (max of 1.79% for narrow range on day 1). The fact that the token pairs are highly correlated as well as daily price movements not exceeding 0.03% means that IL risks are significantly lowered. In this case, the configured 0.008% pool fee reflects the risks taken by the LP. In short, token specific factors limit the pool configuration (i.e. trading fees) which in turn caps the APR for even the narrowest ranges. For LPs seeking higher APRs, they will have to turn to more exotic pairs.
Moderate Risk: WETH-USDC
Note: To avoid the complexity of split liquidity for multi-chain tokens, we will assume that WETH is representative of ETH as a whole. ETH and WETH are therefore used interchangeably in this guide.
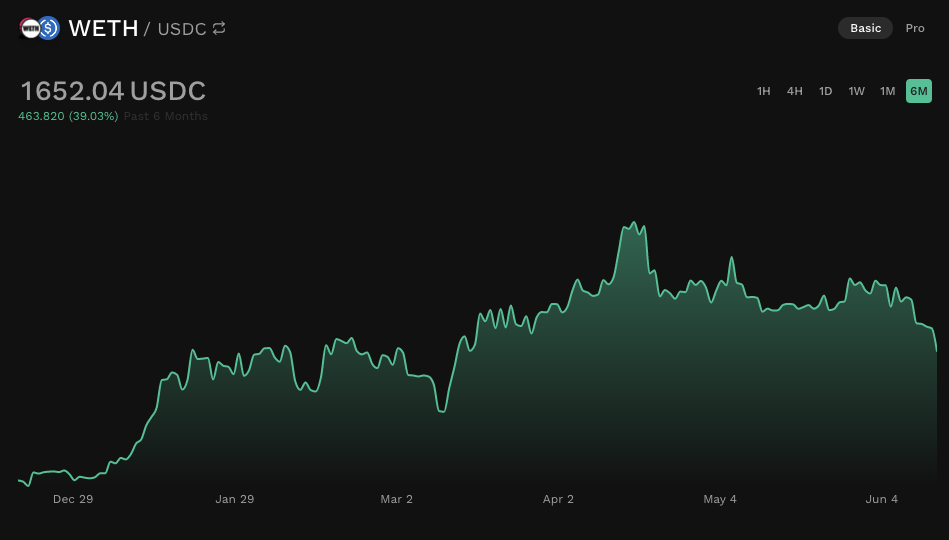
USDC value is derived from fiat deposits and hence LPs in this pool are only exposed to movements in WETH price. This pair enables LPs to effectively DCA in and out of WETH depending on the direction of WETH’s price movement while still getting a portion of the trading fees.
Token Specific Factors
- Token market capitalization: WETH and USDC are consistently amongst the largest tokens by market cap.
- Constant token trade volume: WETH and USDC are the third and fourth most traded tokens by volume.

- Token distribution: Both WETH and USDC are widely distributed with an extremely high circulating supply to total supply ratio.
- Token correlation: WETH price is independent of USDC with USDC acting as a stable unit of account. LPs effectively have single-sided exposure.
Positions Created

3 positions were created at the market price of 1WETH:1,887.24USDC.
| Position | Min Price | Max Price | Min Price % Deviation | Max Price % Deviation |
| Narrow | 1,829.93 | 1,943.07 | 3.1 | 2.9 |
| Medium | 1,758.18 | 2,022.36 | 6.7 | 7.3 |
| Wide | 1,623.01 | 2,190.77 | 10 | 14 |
Results
[smartslider3 slider=”3″]
Narrow Range (3 Ticks)
| Day | 0 | 1 | 2 | 3 | 4 | 5 | 6 | 7 |
| My Liquidity Balance (USD) | 20 | 20.67 | 20.74 | 20.34 | 20.55 | 20.94 | 20.93 | 20.99 |
| My Pool APR (%) | 0 | 90.13 | 102.11 | 110.43 | 94.02 | 151.24 | 122.8 | 125.52 |
| My Pooled USDC | 10.6999 | 5.69676 | 10.2956 | 2.56082 | 5.64037 | 17.5188 | 17.5188 | 19.9494 |
| My Pooled WETH | 0.00536118 | 0.00803138 | 0.00557556 | 0.00972472 | 0.00806169 | 0.00178293 | 0.00178293 | 0.000524132 |
Medium Range (7 Ticks)
| Day | 0 | 1 | 2 | 3 | 4 | 5 | 6 | 7 |
| My Liquidity Balance (USD) | 20 | 20.08 | 20.12 | 19.82 | 19.97 | 20.35 | 20.33 | 20.44 |
| My Pool APR (%) | 0 | 38.97 | 44.2 | 47.61 | 40.64 | 65.36 | 53.1 | 54.14 |
| My Pooled USDC | 10.2199 | 8.11854 | 10.0501 | 6.80139 | 8.09486 | 13.084 | 13.084 | 14.1049 |
| My Pooled WETH | 0.00528831 | 0.00640985 | 0.00537835 | 0.00712108 | 0.00642258 | 0.00378538 | 0.00378538 | 0.00325666 |
Wide Range (15 Ticks)
| Day | 0 | 1 | 2 | 3 | 4 | 5 | 6 | 7 |
| My Liquidity Balance (USD) | 20 | 19.9 | 19.93 | 19.67 | 19.8 | 20.17 | 20.15 | 20.27 |
| My Pool APR (%) | 0 | 18.54 | 21.04 | 22.63 | 19.33 | 31.09 | 25.27 | 25.73 |
| My Pooled USDC | 10.0599 | 9.06905 | 9.97991 | 8.44794 | 9.05788 | 11.4105 | 11.4105 | 11.8919 |
| My Pooled WETH | 0.00527299 | 0.00580186 | 0.00531545 | 0.00613724 | 0.00580786 | 0.00456428 | 0.00456428 | 0.00431496 |
Price Movement
| Day | 0 | 1 | 2 | 3 | 4 | 5 | 6 | 7 |
| USDC per WETH Price | 1887.24 | 1860.33 | 1885.06 | 1843.56 | 1860.02 | 1924.23 | 1924.23 | 1937.5 |
| % Change From Previous Day | – | -1.45% | 1.31% | -2.25% | 0.88% | 3.34% | 0.00% | 0.68% |
Observations
Notice that relative to the USDC-USDT pool, even the narrowest position range in the WETH-USDC pool is significantly wider than the widest range in the USDC-USDT pool (6% vs 0.03%). As a result of this range width, all positions in the WETH-USDC pool remained active for the duration of the observation.
Tick spacing (i.e. smallest buckets to which LPs can add liquidity to) is usually configured relative to the fee tier and hence a higher fee tier in the WETH-USDC pool results in each tick being much wider. This pool configuration reiterates on the importance of the token correlation as by adding liquidity to this pool, LPs are indicating that they believe that the market will be willing to pay a 1% premium to trade against the pool. This is evidenced by the fact that the daily price movements tend to be greater than the fee tier.
With all positions being in-the-money, the narrow range position APR is approximately 2x and 5x more efficient than the medium and wider range position respectively. This is a significant difference in returns and emphasizes the benefits of concentrated liquidity more clearly. The rate of return for narrower ranges is significantly higher but will be counterbalanced by the amount of time spent out-of-range.
High Risk: WBTC-WETH
Note: To avoid the complexity of split liquidity for multi-chain tokens, we will assume that WETH and WBTC are representative of ETH and BTC as a whole. ETH/WETH and BTC/WBTC are therefore used interchangeably in this guide.
LPs are exposed to two of the largest and most well-known cryptocurrencies. This can be for LPs that want full exposure to cryptocurrencies but are indifferent to holding either of crypto’s “blue-chips”.
Token Specific Factors
- Token market capitalization: WBTC and WETH are the two largest tokens by market capitalization.
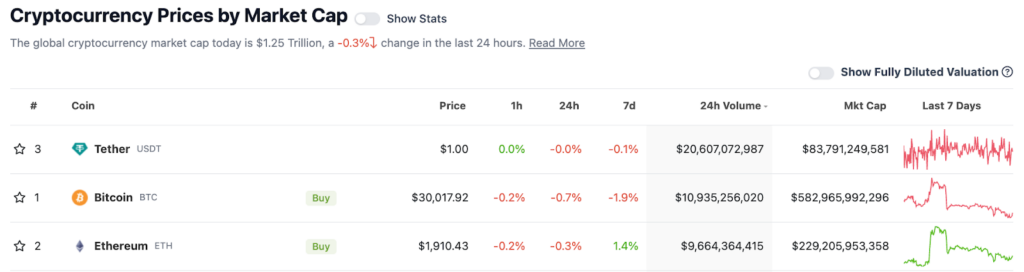
- Constant token trade volume: WBTC and WETH are consistently amongst the top 3 traded tokens by daily volume.
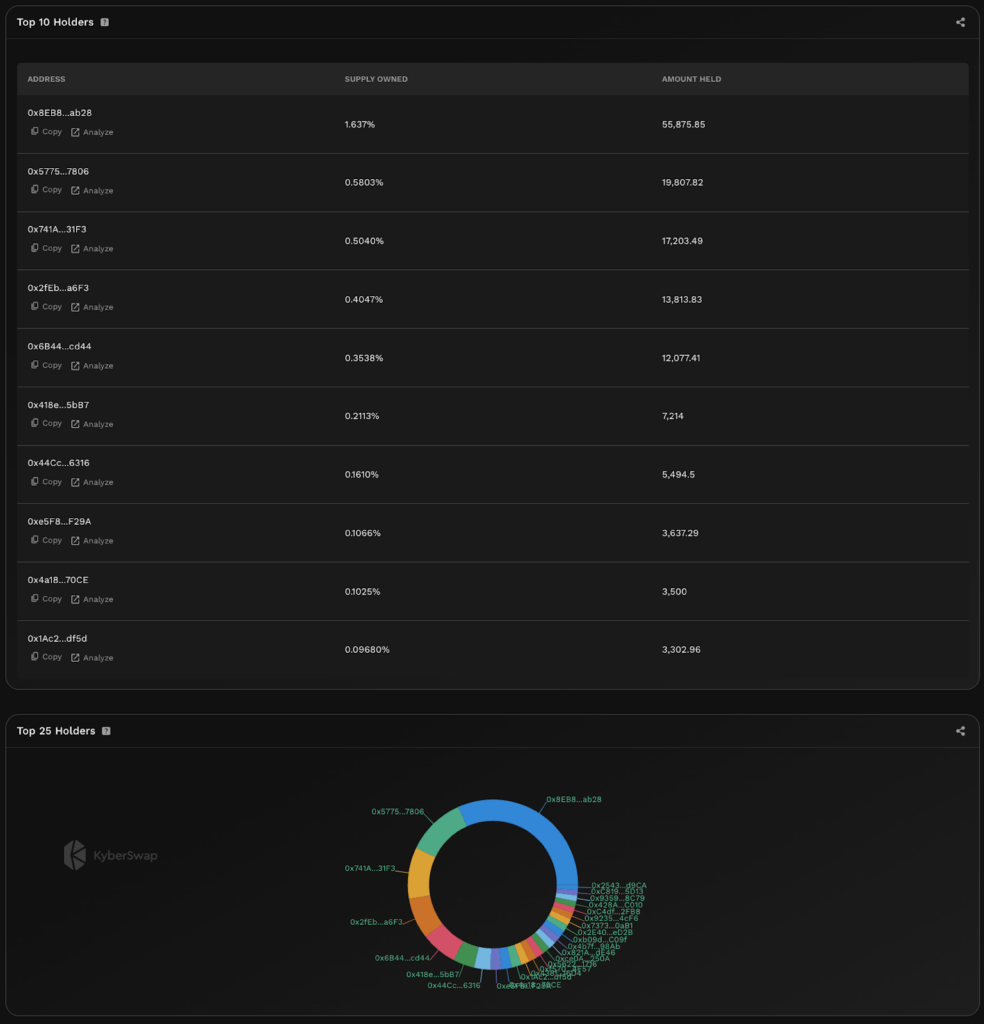
- Token distribution: Both WBTC and WETH are widely distributed with an extremely high circulating supply to total supply ratio.
- Token correlation: While each token has its own specific market factors, WBTC and WETH tend to be moderately correlated due to their positions as the largest tokens.
Positions Created
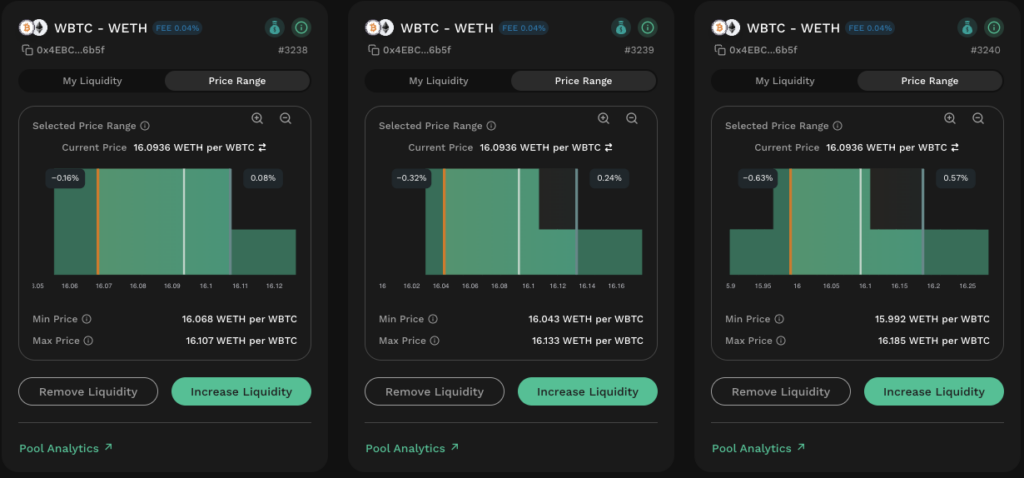
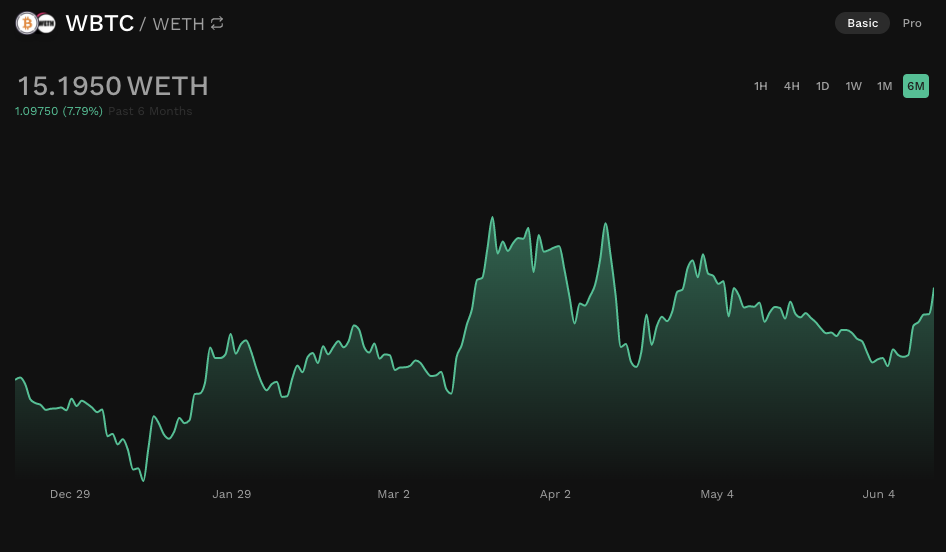
3 positions were created at the market price of 1WBTC:16.0936WETH.
| Position | Min Price | Max Price | Min Price % Deviation | Max Price % Deviation |
| Narrow | 16.068 | 16.107 | 0.16 | 0.08 |
| Medium | 16.043 | 16.133 | 0.32 | 0.24 |
| Wide | 15.992 | 16.185 | 0.63 | 0.87 |
Results
[smartslider3 slider=”4″]
Narrow Range (3 Ticks)
| Day | 0 | 1 | 2 | 3 | 4 | 5 | 6 | 7 |
| My Liquidity Balance (USD) | 20 | 19.82 | 19.93 | 19.46 | 19.68 | 20.1 | 20.18 | 20.29 |
| My Pool APR (%) | 0 | 75.95 | 53.8 | 36.03 | 26.69 | 25.77 | 20.9 | 18.87 |
| My Pooled WBTC | 0.00000933 | 0 | 0 | 0 | 0 | 0.00066127 | 0.00066127 | 0.00066127 |
| My Pooled WETH | 0.0104879 | 0.0106383 | 0.0106383 | 0.0106383 | 0.0106383 | 0 | 0 | 0 |
Medium Range (7 Ticks)
| Day | 0 | 1 | 2 | 3 | 4 | 5 | 6 | 7 |
| My Liquidity Balance (USD) | 20 | 19.83 | 19.94 | 19.47 | 19.69 | 20.11 | 20.19 | 20.3 |
| My Pool APR (%) | 0 | 62.4 | 41.87 | 28.04 | 20.77 | 20.51 | 16.63 | 14.96 |
| My Pooled WBTC | 0.00019285 | 0 | 0 | 0 | 0 | 0.00066164 | 0.00066164 | 0.00066164 |
| My Pooled WETH | 0.00753557 | 0.0106443 | 0.0106443 | 0.0106443 | 0.0106443 | 0 | 0 | 0 |
Wide Range (15 Ticks)
| Day | 0 | 1 | 2 | 3 | 4 | 5 | 6 | 7 |
| My Liquidity Balance (USD) | 20 | 19.8 | 19.91 | 19.44 | 19.67 | 20.09 | 20.16 | 20.27 |
| My Pool APR (%) | 0 | 37.16 | 31.03 | 20.79 | 15.39 | 15.95 | 12.93 | 11.63 |
| My Pooled WBTC | 0.00026572 | 0 | 0 | 0 | 0 | 0.00066082 | 0.00066082 | 0.00066082 |
| My Pooled WETH | 0.00634101 | 0.0106312 | 0.0106312 | 0.0106312 | 0.0106312 | 0 | 0 | 0 |
Price Movement
| Day | 0 | 1 | 2 | 3 | 4 | 5 | 6 | 7 |
| WBTC – WETH Price | 16.0877 | 16.2885 | 16.3167 | 16.4461 | 16.4564 | 15.8329 | 15.9291 | 15.815 |
| % Change From Previous Day | – | 1.23% | 0.17% | 0.79% | 0.06% | -3.94% | 0.60% | -0.72% |
Observations
All 3 positions spent the majority of time out-of-range following significant volatility for the WBTC-WETH pair. While the narrow range position would have gone out of range first, the rate at which the price moved made any additional time the wider range positions spent in-the-money insignificant. This further highlights the fact that the APR difference between narrower and wider position ranges is the difference in the rate of return multiplied by the time that the narrower position is out-of-range.
In retrospect, the position ranges selected might have been too narrow to properly capture the market between WBTC and WETH. Nonetheless, the narrower ranges also allows us to observe differences in behavior when the positions rapidly became active again and went out-of-range in the other direction (as per day 5). Notice that since the market fell through all the position ranges, the token balances were flipped. Moreover, while a straight price drop through all the positions would result in the same fees (position TVL is the same), the wider range position is more likely to catch any minor bounces on the way down resulting in more fees.
Degen Risk: KNC-AAVE
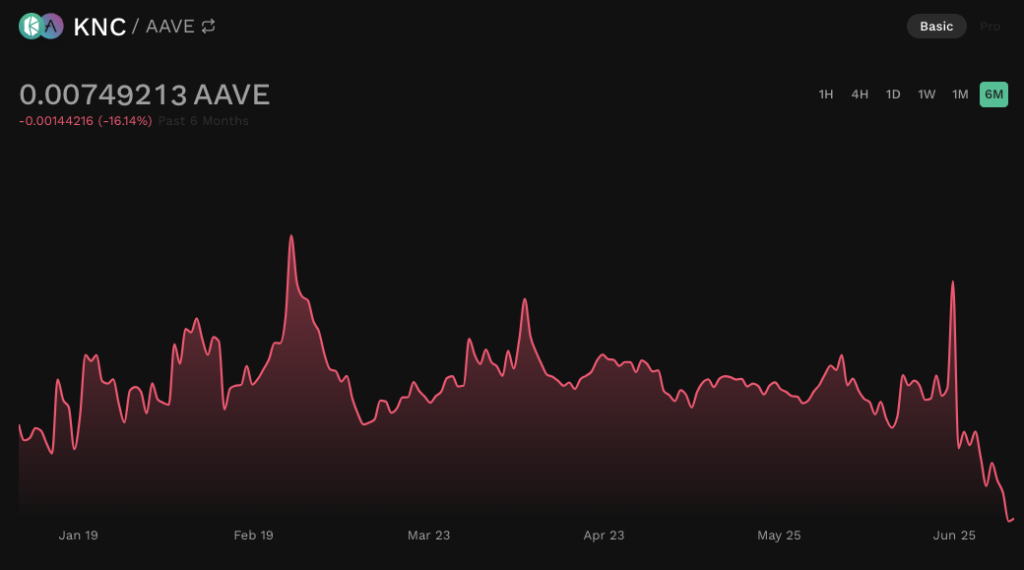
Tokens outside the top 10 are selected with tokens being weakly correlated. Note that the tokenomics and presence of AAVE and KNC already make it a relatively less degen pair for market making with risks scaling significantly for more exotic tokens.
Token Specific Factors
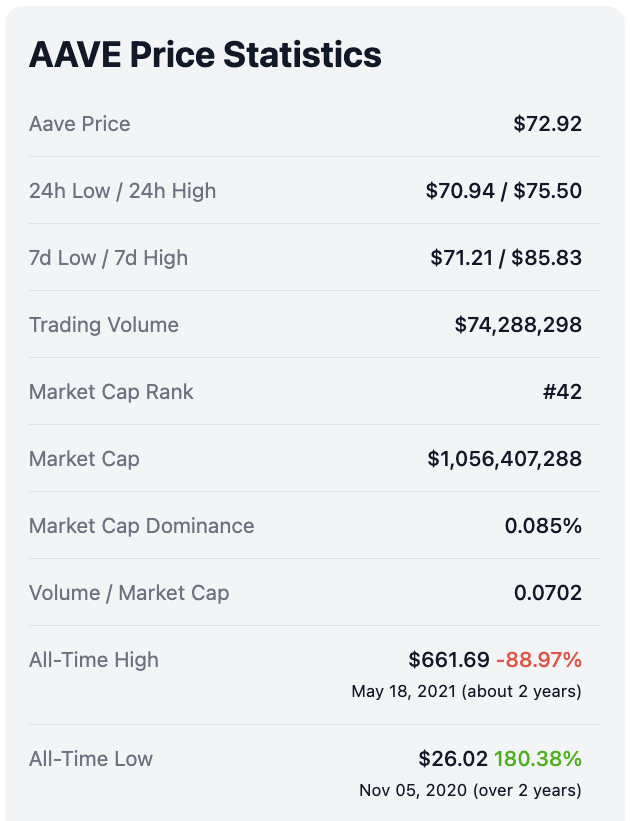
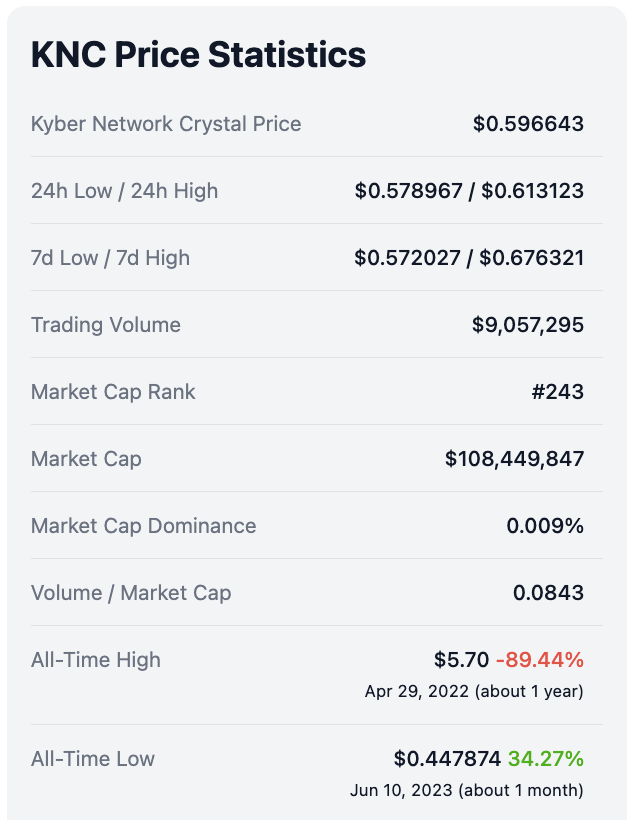
- Token market capitalization: KNC usually sits in the top 200-300 range of tokens by market cap while AAVE makes the cut of the top 50 tokens.
- Constant token trade volume: KNC has a trade volume which ranks between 200-250 range while AAVE is consistently amongst the top 50 traded tokens.
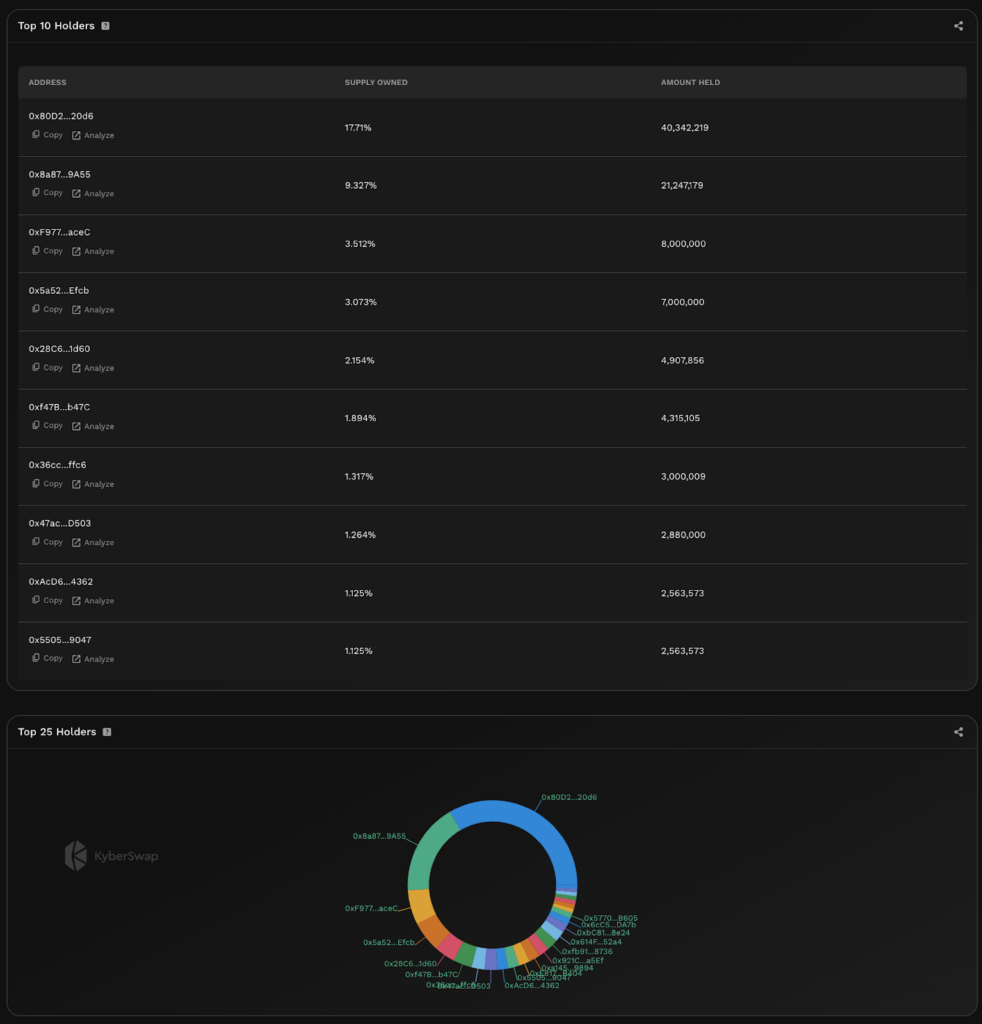
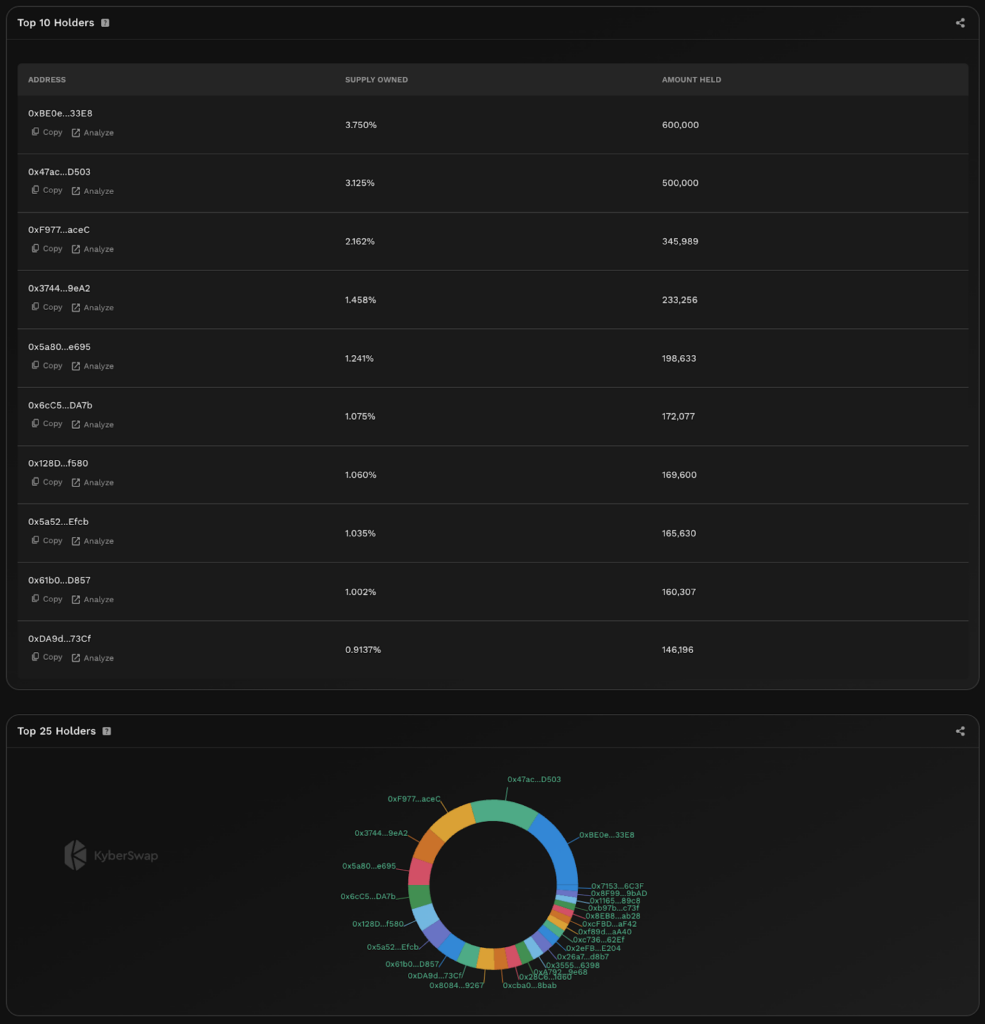
- Token distribution: KNC and AAVE distribution is more limited. Both tokens also have a circulating supply that is measurably less than the total supply.
- Token correlation: Price movements for each token will likely be tied back to token specific factors and there are no obvious relationships between the tokens.
Positions Created
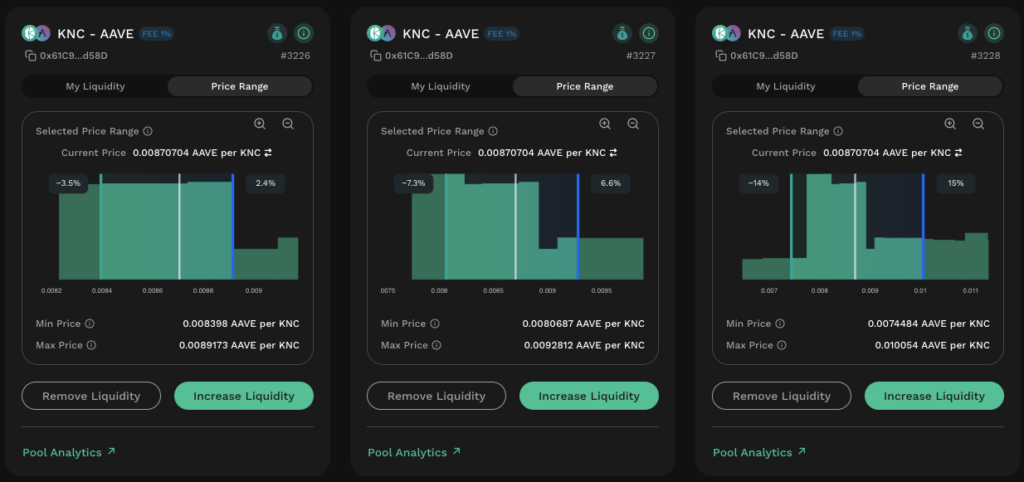
3 positions were created at the market price of 1KNC:0.00870704AAVE.
| Position | Min Price | Max Price | Min Price % Deviation | Max Price % Deviation |
| Narrow | 0.008398 | 0.0089173 | 3.5 | 2.4 |
| Medium | 0.0080687 | 0.0092812 | 7.3 | 6.6 |
| Wide | 0.0074484 | 0.010054 | 14 | 15 |
Results
[smartslider3 slider=”5″]
Narrow Range (3 Ticks)
| Day | 0 | 1 | 2 | 3 | 4 | 5 | 6 | 7 |
| My Liquidity Balance (USD) | 20 | 19.4 | 19.2 | 17.92 | 18.64 | 19.64 | 19.45 | 19.71 |
| My Pool APR (%) | 0 | 135.4 | 192.64 | 177.83 | 227.55 | 239.62 | 196.46 | 178.74 |
| My Pooled KNC | 14.9683 | 2.22016 | 13.8108 | 1.96384 | 28.5921 | 34.9668 | 34.9668 | 34.9668 |
| My Pooled AAVE | 0.170834 | 0.282834 | 0.180902 | 0.285111 | 0.0538246 | 0 | 0 | 0 |
Medium Range (7 Ticks)
| Day | 0 | 1 | 2 | 3 | 4 | 5 | 6 | 7 |
| My Liquidity Balance (USD) | 20 | 19.49 | 19.22 | 17.98 | 18.64 | 19.82 | 19.67 | 19.92 |
| My Pool APR (%) | 0 | 58.35 | 99.42 | 87.48 | 132.65 | 164 | 148.49 | 144.92 |
| My Pooled KNC | 16.3245 | 10.8049 | 15.8233 | 10.6939 | 22.2232 | 33.1879 | 28.1777 | 35.3315 |
| My Pooled AAVE | 0.15915 | 0.207643 | 0.16351 | 0.208629 | 0.108489 | 0.017368 | 0.0585232 | 0 |
Wide Range (15 Ticks)
| Day | 0 | 1 | 2 | 3 | 4 | 5 | 6 | 7 |
| My Liquidity Balance (USD) | 20 | 19.47 | 19.17 | 17.95 | 18.59 | 19.83 | 19.74 | 20.14 |
| My Pool APR (%) | 0 | 27.73 | 47.32 | 41.59 | 63.15 | 79.8 | 71.83 | 77.46 |
| My Pooled KNC | 16.8243 | 14.2033 | 16.5863 | 14.1506 | 19.6252 | 24.8318 | 22.4528 | 26.9445 |
| My Pooled AAVE | 0.154084 | 0.177111 | 0.156154 | 0.177579 | 0.130028 | 0.0867597 | 0.106302 | 0.0697175 |
Price Movement
| Day | 0 | 1 | 2 | 3 | 4 | 5 | 6 | 7 |
| AAVE per KNC Price | 0.00868926 | 0.0088829 | 0.00870658 | 0.00888686 | 0.00848923 | 0.00813533 | 0.00829424 | 0.00799801 |
| % Change From Previous Day | – | 2.18% | -2.03% | 2.03% | -4.68% | -4.35% | 1.92% | -3.70% |
Observations
For the KNC-AAVE positions, what immediately stands out are the APRs for the wide range position. Even with the same 1% fee tier as per the USDC-WETH pool, the trading fees generated for this pool is significantly higher due to the price volatility between the two exotic tokens. Throughout the observation period, the smallest daily price movement was recorded at 1.92% and even with a ±7% range boundary, the medium range position still went out of-range on the last day. Nonetheless, while the narrow range position remained out-of-range for the last 3 days, the rate of return for the first 4 days was sufficient to outperform the wider range positions.
Another critical behavior to notice is that the dollar value of all positions in the KNC-AAVE pool fluctuates much more as compared to the previous token pairs. A position’s token ratio changes according to the relative value of the tokens but in the case whereby both tokens are experiencing a simultaneous increase or decrease in value, the dollar value of the position will also change accordingly. Given that the altcoin market tends to move in tandem, LPs must also be aware of their dollar value exposure when contributing liquidity for more exotic pairs.
Conclusion
Given the speed at which the crypto market moves, it is possible to make some generalizations based on a week’s worth of data. For every position, the trading fee APR boils down to the relative rate of returns for the selected range versus the amount of time which the position spends out-of-range. Narrower range positions have a much higher rate of return when in range and this higher return rate might be able to offset the time spent out of range when compared to a wider range position which might have spent more time in range but has a lower return rate.
Critically, narrow and wide ranges are all relative and hence LPs will have to baseline these ranges against token specific factors. More exotic pairs will tend to be less correlated resulting in more rapid and significant price movements which could easily result in a position going out-of-range. This is further accentuated by the fact that exotic tokens will also have less available liquidity with tokens being not as widely distributed. These risks can be counterbalanced with the use of higher fee tiers but that is a topic for another article.
Lastly, LPs must also consider the position management overhead in terms of monetary cost as well as time. For smaller positions, gas fees incurred from constant adjustments might offset any potential gains. For larger positions, the potential price impact when sourcing the right amount of tokens will be a significant cost. Crucially, LPs must be aware of the not insignificant amount of time that is required to actively manage their positions especially when the crypto market never sleeps.
Given how multifaceted a position range choice is, the best way to arrive at the optimal range for your position is to experiment with multiple smaller positions in the same pool. By tweaking your position ranges from there, you will be able to arrive at a specific range that suits your risk and management preferences. Through this, you will also be able to gain a better appreciation of how your specified range reacts relative to market developments. Just remember that every token pair is unique and hence deserving of its own analysis. Choosing the best position range is hard work but when done right, the risk-adjusted yields are more than worth the effort.