Fee Tiers And APRs
In the first half of this series, we explored the dynamics of the trading fee market and its effects on a LP’s returns. This article brings the concepts covered in previous article to life by tracking 3 positions of varying fee tiers across 4 token pairs with different market characteristics. These 12 positions were tracked over the course of a week (03/07/23-10/07/23) to view the practical effect of fee tiers on LP APRs.
As each pool is uniquely identified by their token pair and fee tier combination, each position had to be created on a separate pool. For each token combination, a wide position range was selected with the minimum and maximum position range being aligned as closely as possible. This ensures that position range specific factors would also be minimized across the 3 positions of varying fees. You can view our position range guide for more information on how to choose the best position range.
Note that all positions were created on Polygon PoS (ChainID: 137) so as to avoid the effects of any chain-specific factors. To simplify further, we will assume WBTC and WETH are representative of BTC and ETH as a whole and therefore multi-chain liquidity considerations are not considered.
- Part 1: How Fee Tiers Make Or Break Your DeFi Returns
- Part 2: A Practical Look At Selecting The Best Fee Tier
Choosing The Best Fee Tier Walkthrough
Highly Correlated: USDT-USDC
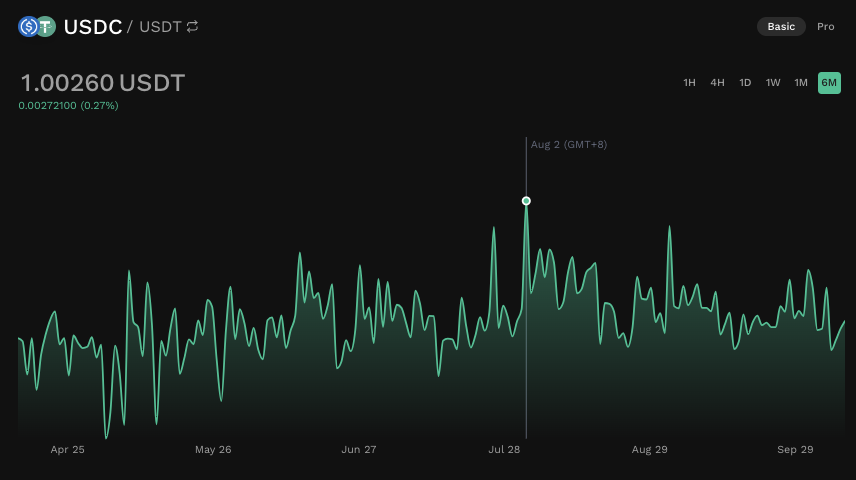
Highly correlated pair with large market cap and trade volume. Both USDC and USDT are pegged to the US dollar and are collateralized based on fiat equivalents. Barring any black swan events, major deviations are expected to be non-existent.
Positions Created
| Fee Tier | Pool Fee (%) | Min Price (USDT:USDC) | Max Price (USDT:USDC) |
|---|---|---|---|
| Low | 0.008 | 0.99005 | 1.01005 |
| Mid | 0.04 | 0.990446 | 1.01045 |
| High | 0.1 | 0.99005 | 1.01005 |
Results
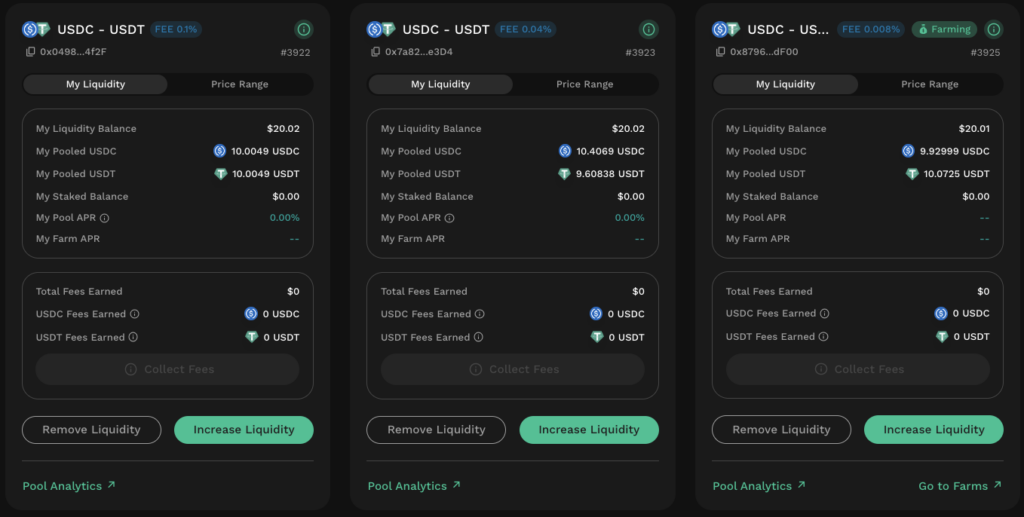
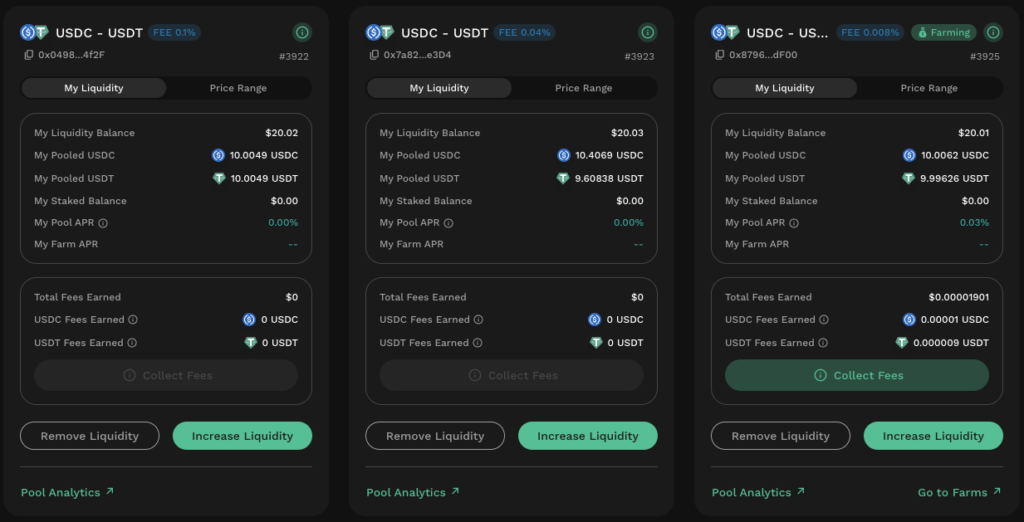
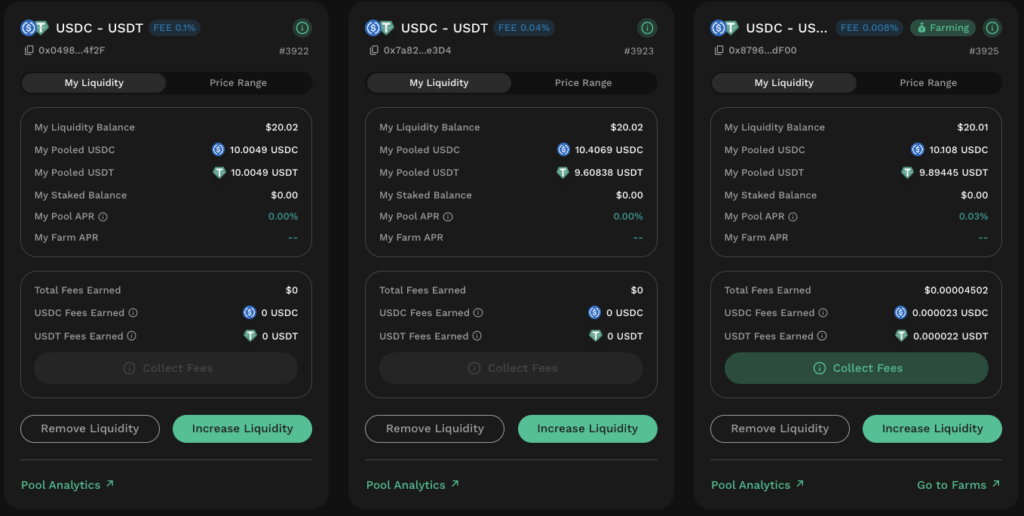

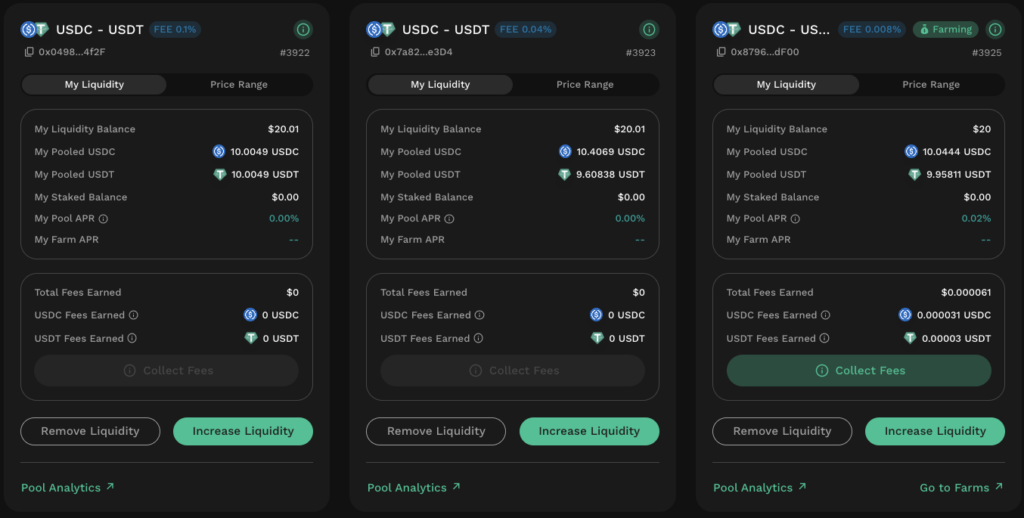


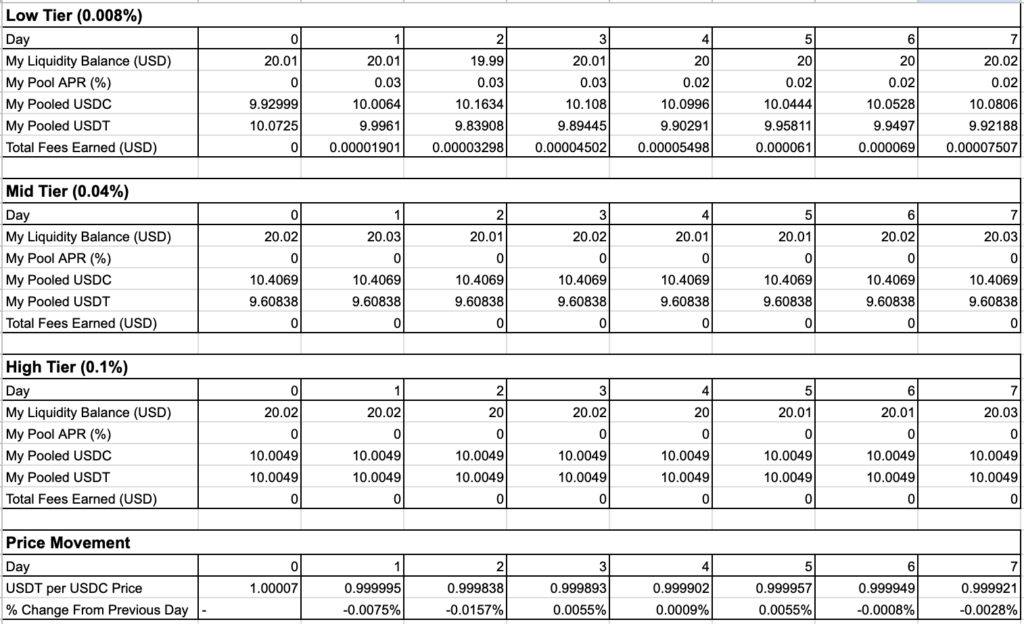
Observations
What becomes immediately clear for this stable pair is that only the lowest fee tier pool generated any fees throughout the observation period. This means that no trades were routed via the higher fee tier pools as even the pool price for the mid fee tier pool did not diverge from the market price by more than the 0.04% fee.
Stablecoin depeg risks aside, this means that USDC-USDT LPs requires significant trade volume in order to generate a reasonable return. While the low fee tier pool APRs are suppressed in this demo due to the wider range selection, the overall APRs for stable pools also tend to be lower which implies the lower market making risks for this pair.
For every dollar of trade facilitated, the LP will get a fee of USD0.00008 (i.e. 0.008%). As such, to get a 1% return, the market must have oscillated ±0.008% from the pool price 125 times! Looking at the daily % price changes which rarely exceeds >0.01%, it becomes obvious that the rate of returns will be highly dependent on the frequency of trades and the trade volume.
Moderately Correlated: WBTC-WETH
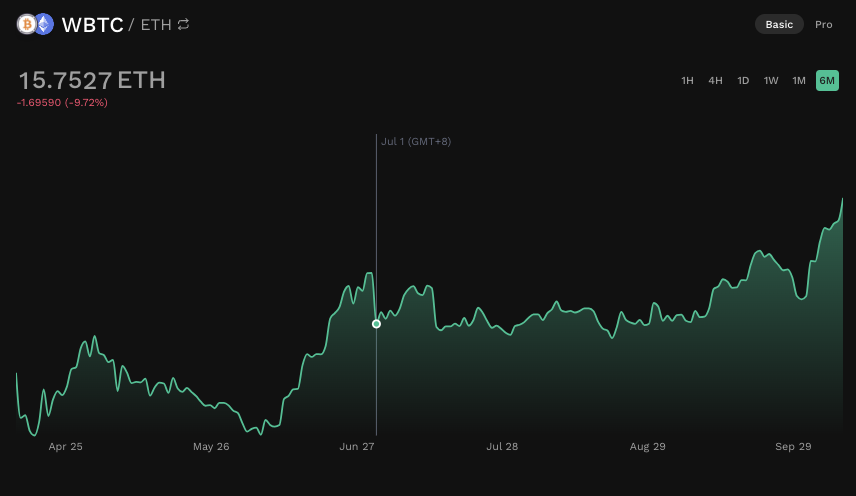
LPs are exposed to two of the largest and most well-known cryptocurrencies which act as the industry’s “blue-chips”. Consequently, WBTC and WETH tend to be moderately correlated as they tend to move in tandem with overall macro crypto sentiment. Token-specific factors usually result in temporary divergences whose amplitude is limited due to the sheer market capitalization of both tokens.
Note: To avoid the complexity of split liquidity for multi-chain tokens, we will assume that WETH and WBTC are representative of ETH and BTC as a whole. ETH/WETH and BTC/WBTC are therefore used interchangeably in this guide.
Positions Created
| Fee Tier | Pool Fee (%) | Min Price (WETH:WBTC) | Max Price (WETH:WBTC) |
|---|---|---|---|
| Low | 0.04 | 15.0724 | 16.6574 |
| Mid | 0.1 | 15.0724 | 16.6574 |
| High | 1 | 15.0724 | 16.6574 |
Results
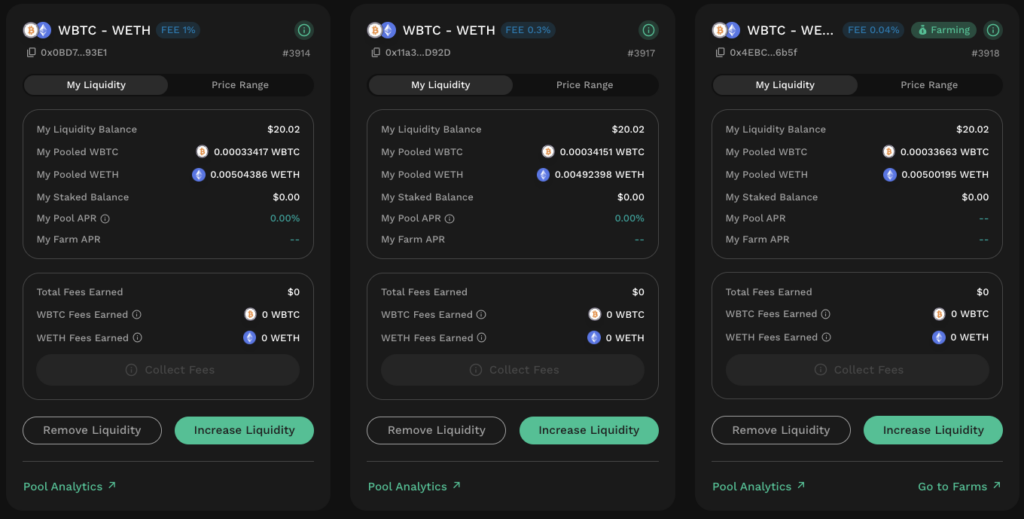
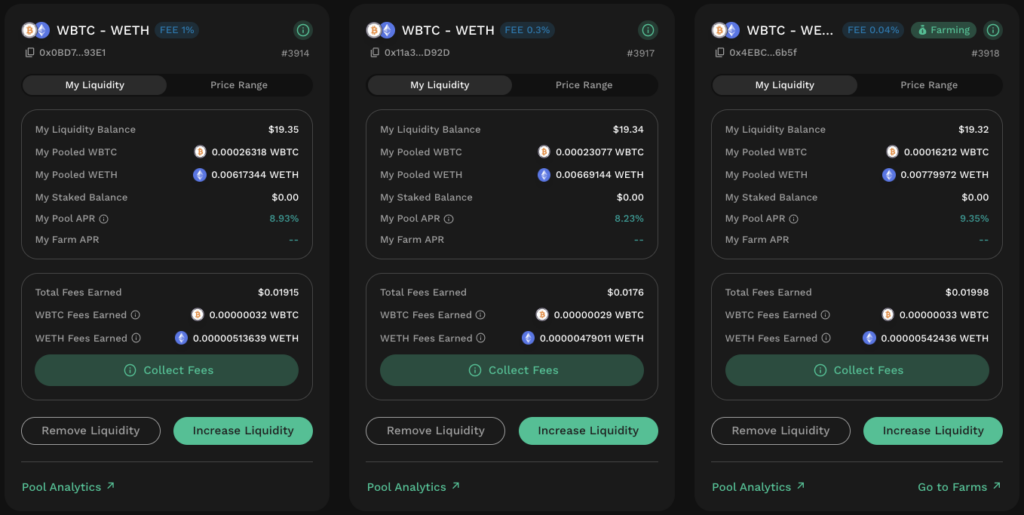

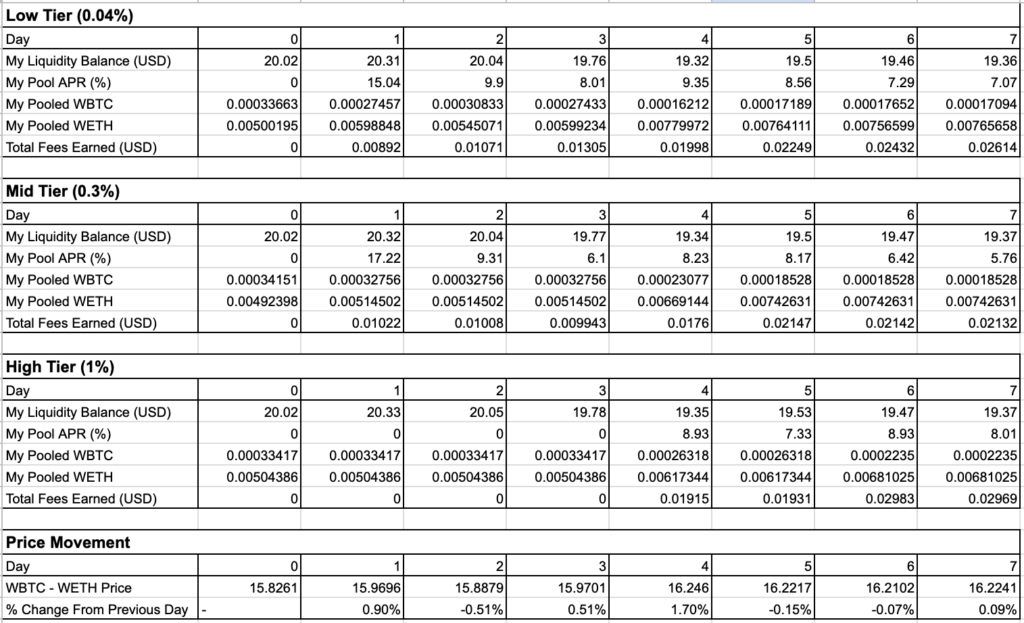
Observations
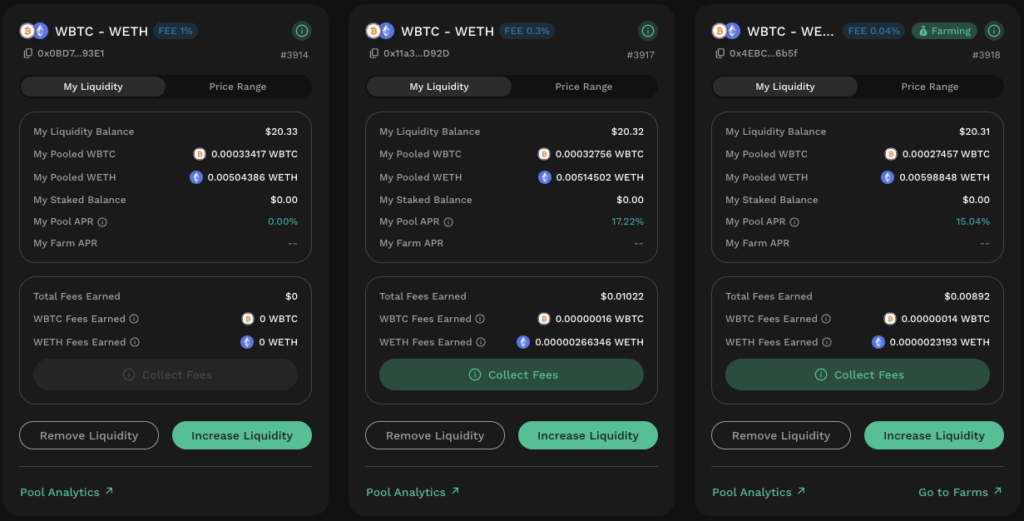
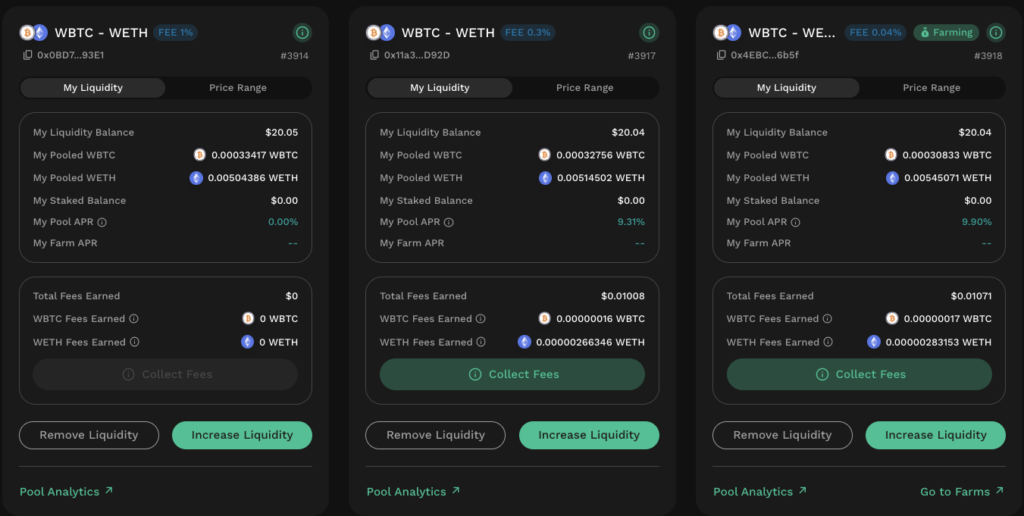
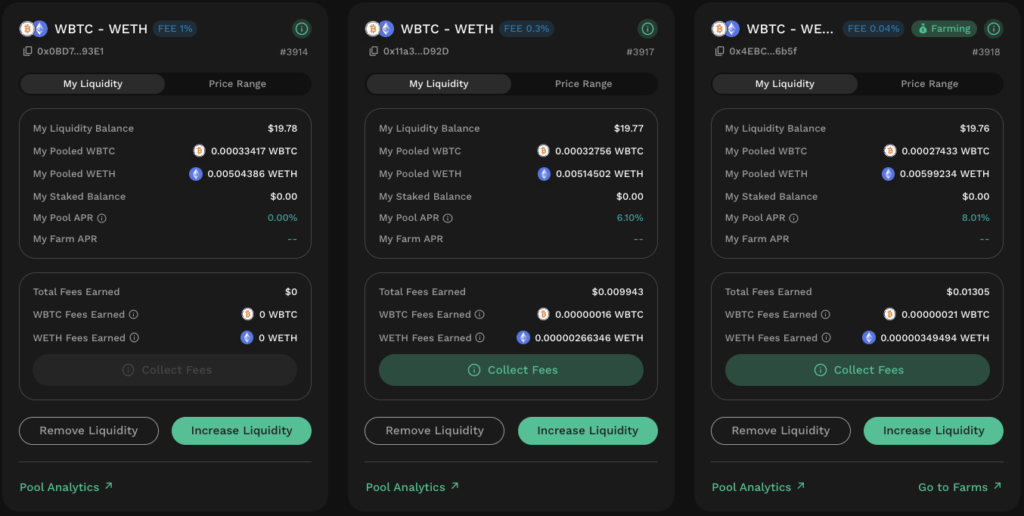
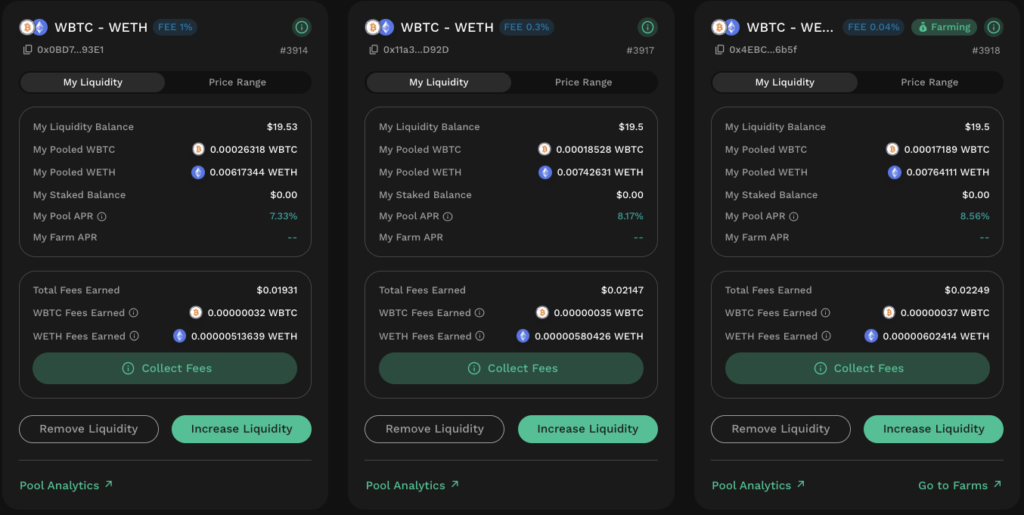
The first thing to notice for the WBTC-WETH pair is that the market for the two tokens was sufficiently volatile such that the 0.3% fee tier pool was able to generate fees from the start. However, trades were only routed via the 1% fee tier pool on day 4 where the market experienced a significant shift. Even so, the total fees earned by the high fee tier pool was able to quickly catch up and even surpass the lower fee tier pools by the end of the week.
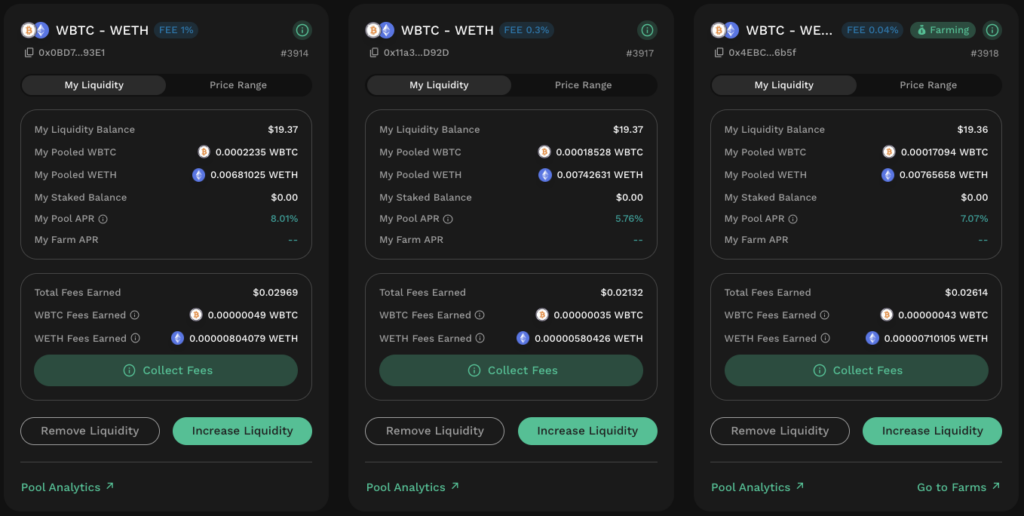
To generate the same amount of fees, the lower fee tier pool must have facilitated 25x the volume of the higher fee tier pool. Whether this threshold value is hit depends on the observation period as the low fee tier pool was consistently outperforming the high fee tier pool until Day 6. Actively traded token pairs might benefit from lower fee tiers as long as the market trades long enough within a narrower range during times of relative calm.
Crucially, the pool price will always lag the market by the configured fee tier percentage. Recall that trades will only be routed to the pool if the market price is ±feeTier% from the pool price. Consequently, each time the market changes direction, the pool will forgo trades of [peakOrThroughPrice x feeTier%] in the direction before the switch and [peakOrThroughPrice x 2 x feeTier%] in the direction after the switch.
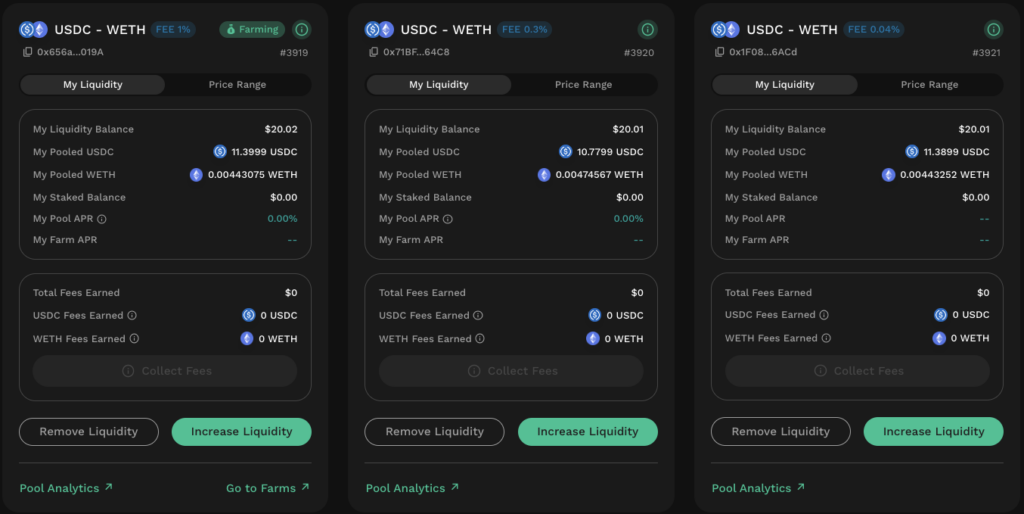
Low Correlation: USDC-WETH
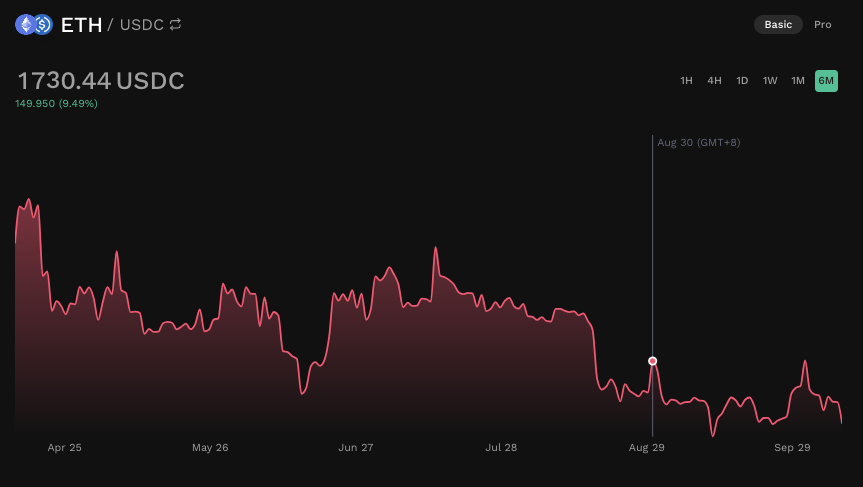
USDC value is derived from fiat deposits and hence LPs in this pool are only exposed to movements in WETH price. While the price divergence for this pair can be significant when the macro market is particularly bullish/bearish, this pair tends to trade within relatively narrow ranges outside of major news.
Note: To avoid the complexity of split liquidity for multi-chain tokens, we will assume that WETH is representative of ETH as a whole. ETH and WETH are therefore used interchangeably in this guide.
Positions Created
| Fee Tier | Pool Fee (%) | Min Price (USDC:WETH) | Max Price (USDC:WETH) |
|---|---|---|---|
| Low | 0.04 | 1,829.92 | 2,022.36 |
| Mid | 0.3 | 1,833.58 | 2,030.47 |
| High | 1 | 1,829.92 | 2,022.36 |
Results
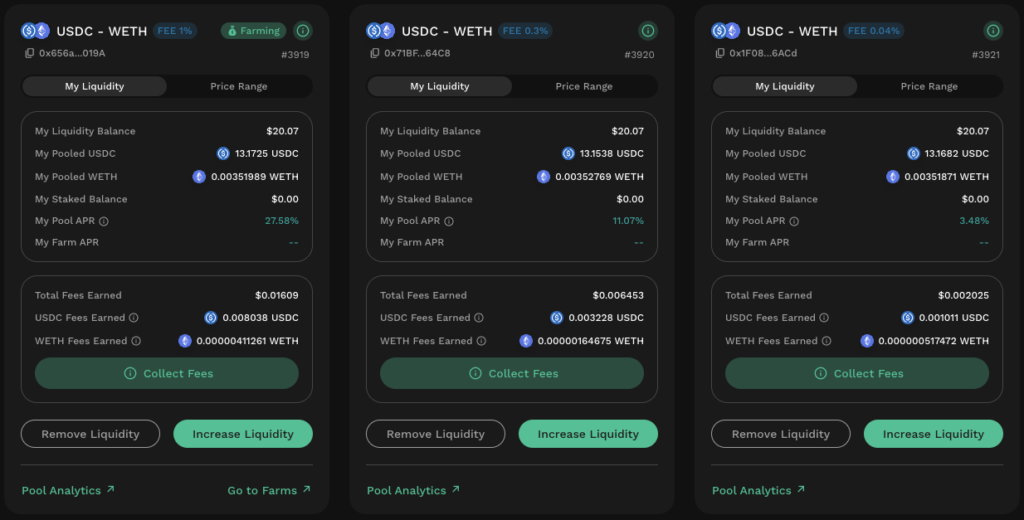
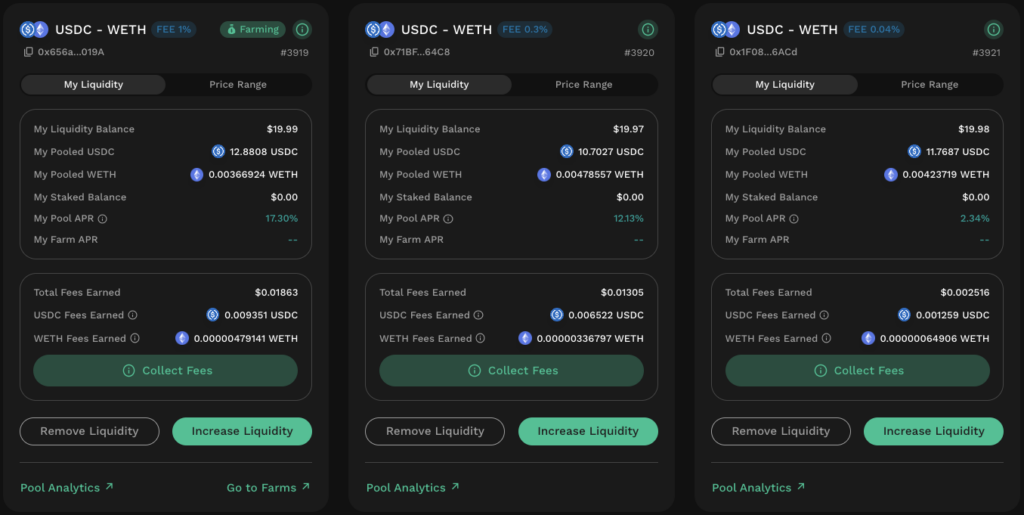
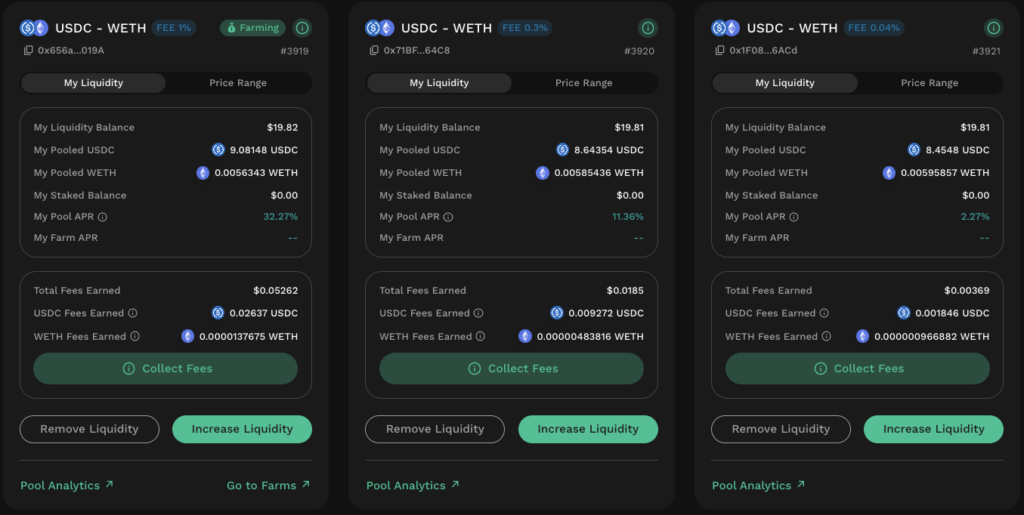
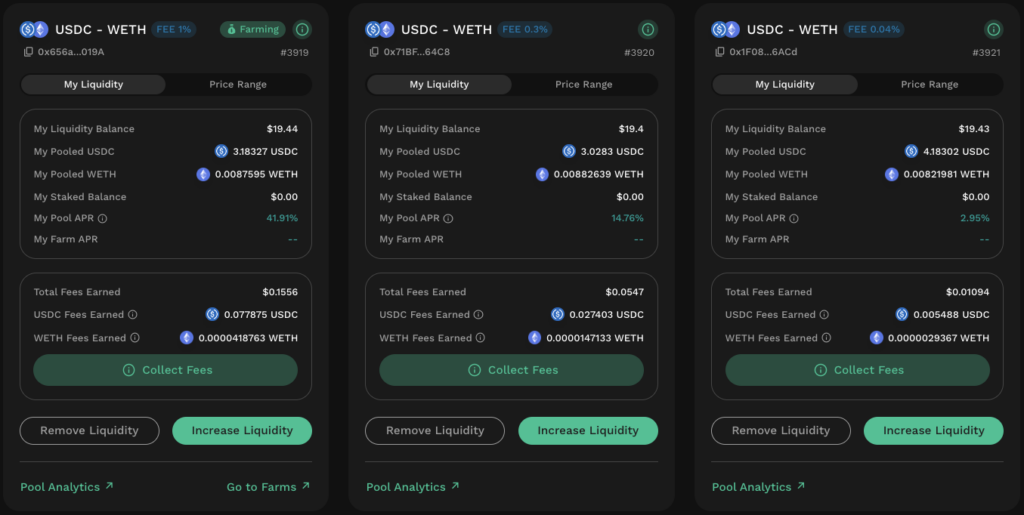
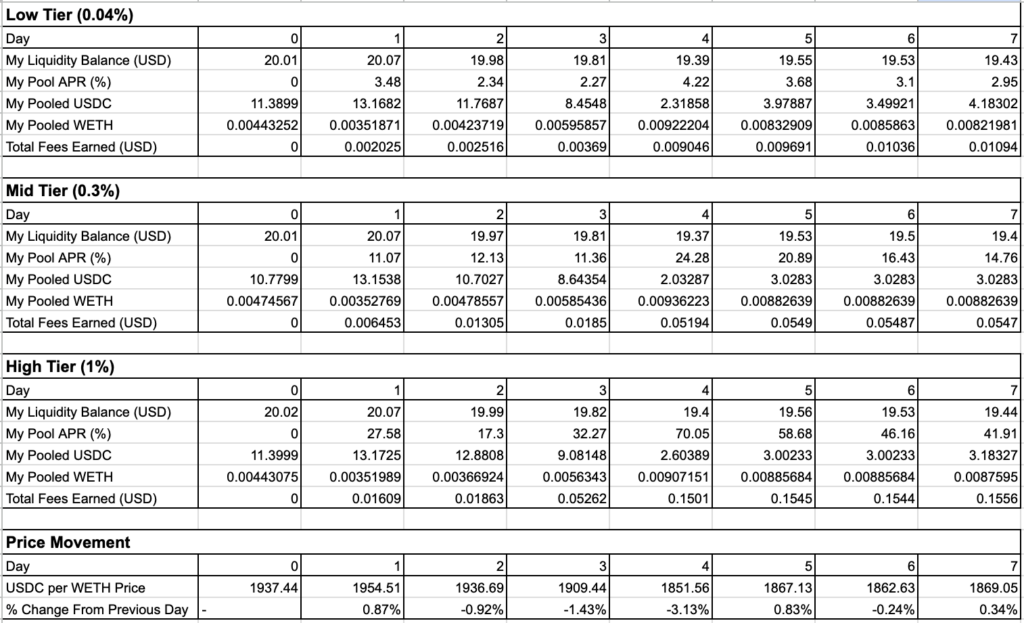
Observations
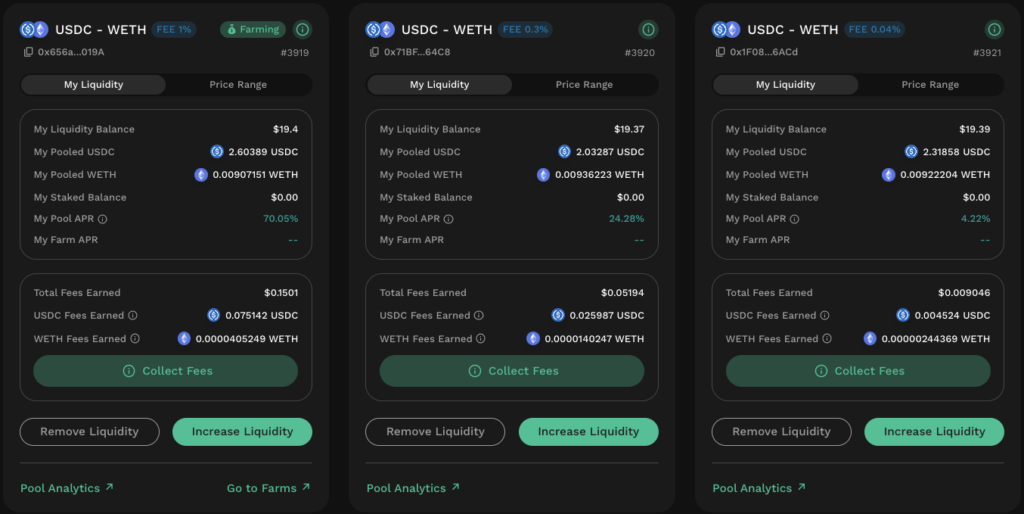
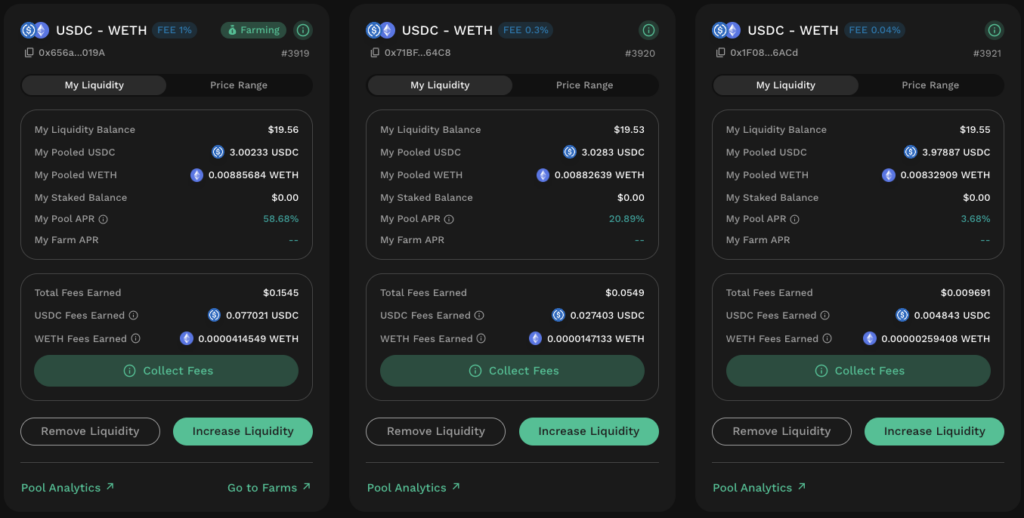
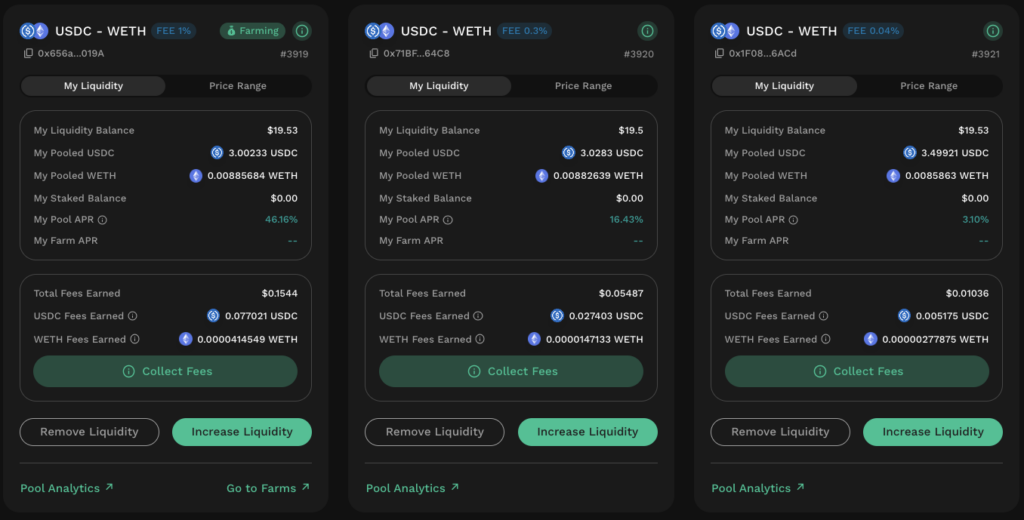
Looking at the daily % price changes, we can see that WETH price for the observation period was relatively volatile resulting in especially high APRs for the higher fee tier pools. On day 4 where WETH dropped by more than 3%, the APR for the high fee tier position even went up to 70% based on the configured position range.
Critically, when prices move significantly in a single direction, the fees earned are significantly greater for the higher fee tier pool. This makes intuitive sense as lower fee tier pools never had the chance to generate additional fees from smaller market corrections. In such cases, trade volume through each pool is almost identical save for minor differences at the peak/through.
The above mechanism can be inferred when comparing the daily positional movements between the high and low fee tier positions. The token balances for the lower fee tier position moves much more frequently implying more trades facilitated. Nonetheless, the fees generated by the low fee tier position is multiple times less than the high fee tier positions.
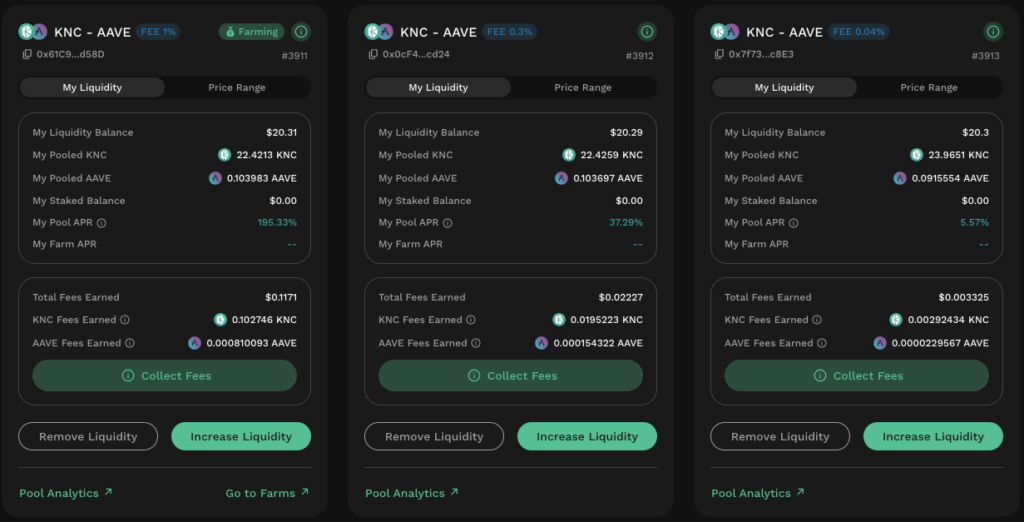
Degens: KNC-AAVE
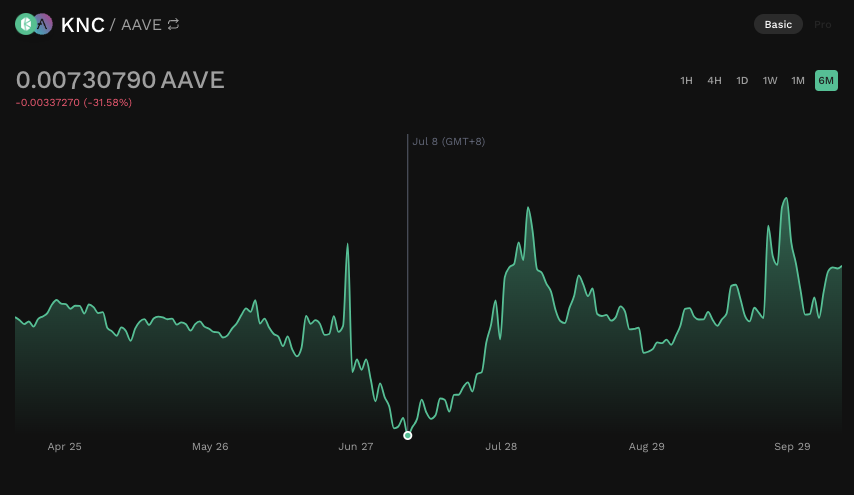
Weakly correlated pair where token-specific factors could result in significant swings in prices where impermanent loss has a much higher chance of becoming permanent. Given the market cap of each token, the amplitude of the swings also tend to be larger. There are no obvious correlations between the tokens.
Note that the tokenomics and presence of AAVE and KNC already make it a relatively less degen pair for market making with risks scaling significantly for more exotic tokens.
Positions Created
| Fee Tier | Pool Fee (%) | Min Price (AAVE:KNC) | Max Price (AAVE:KNC) |
|---|---|---|---|
| Low | 0.04 | 0.00759886 | 0.008398 |
| Mid | 0.3 | 0.00761407 | 0.00843166 |
| High | 1 | 0.00759886 | 0.008398 |
Results
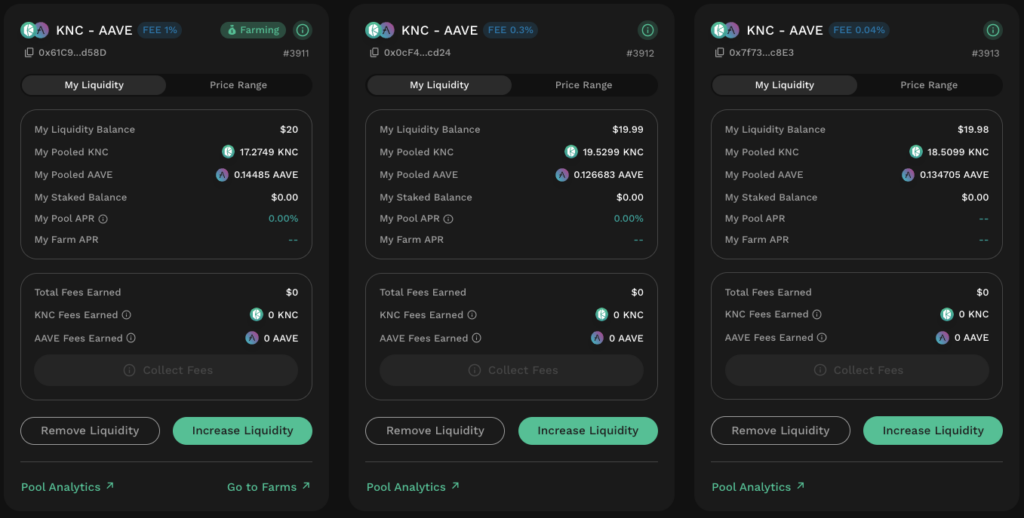

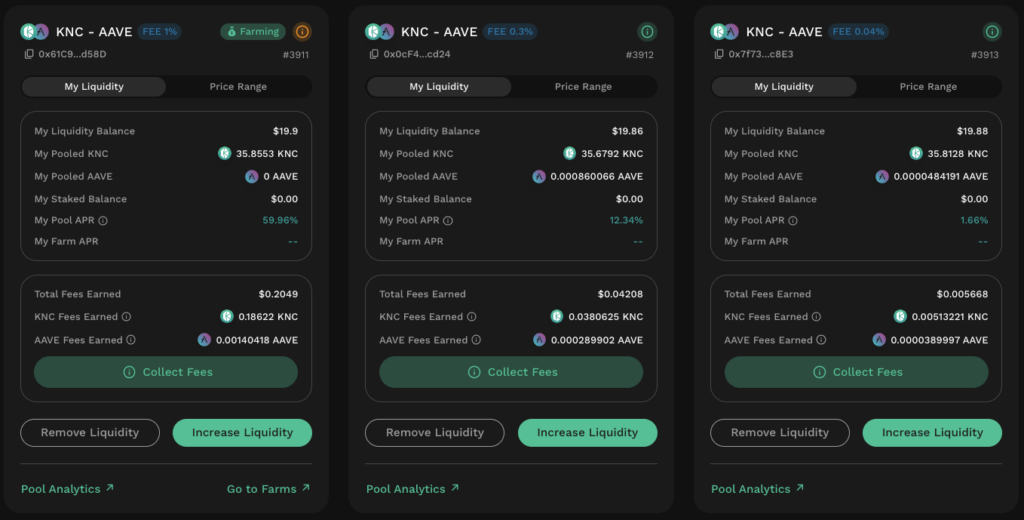
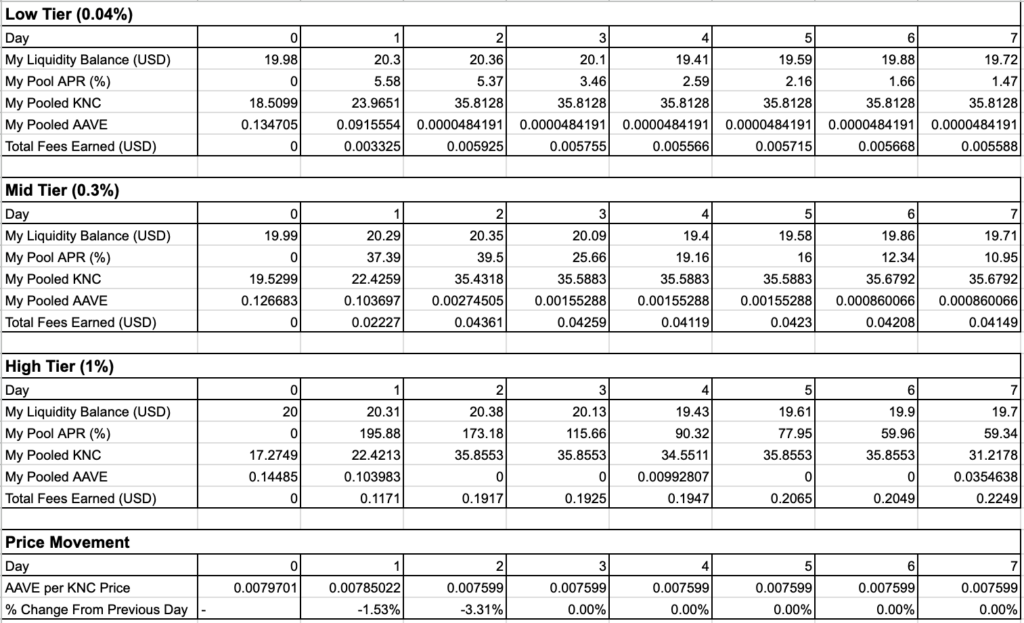
Observations
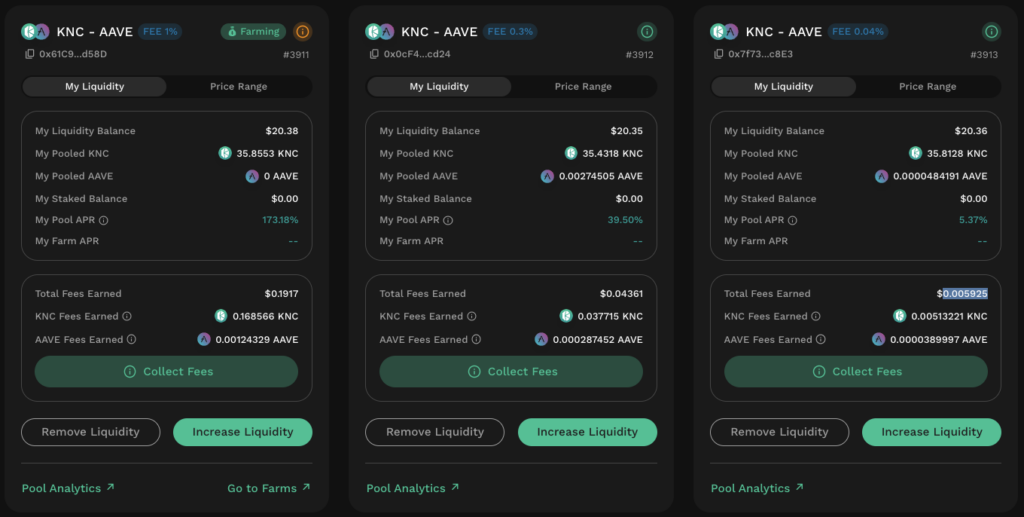
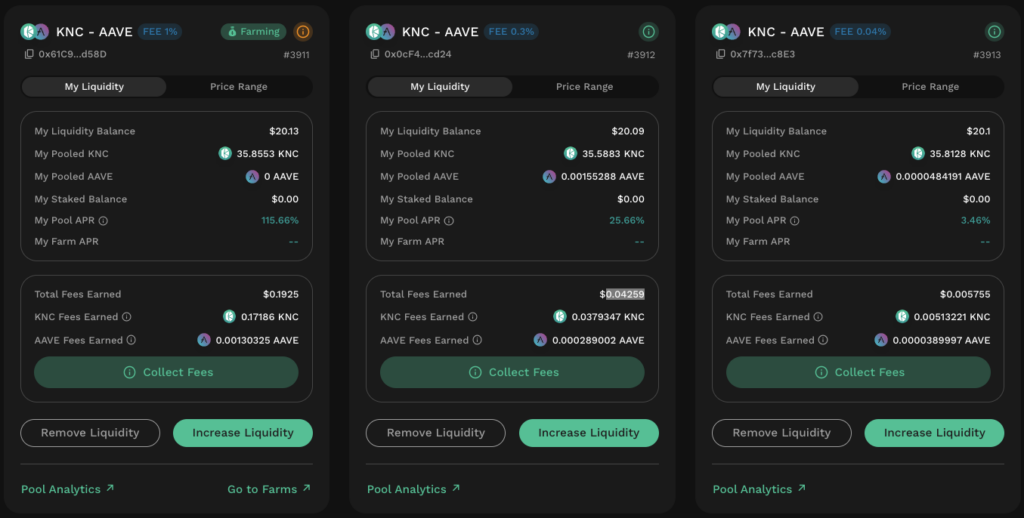
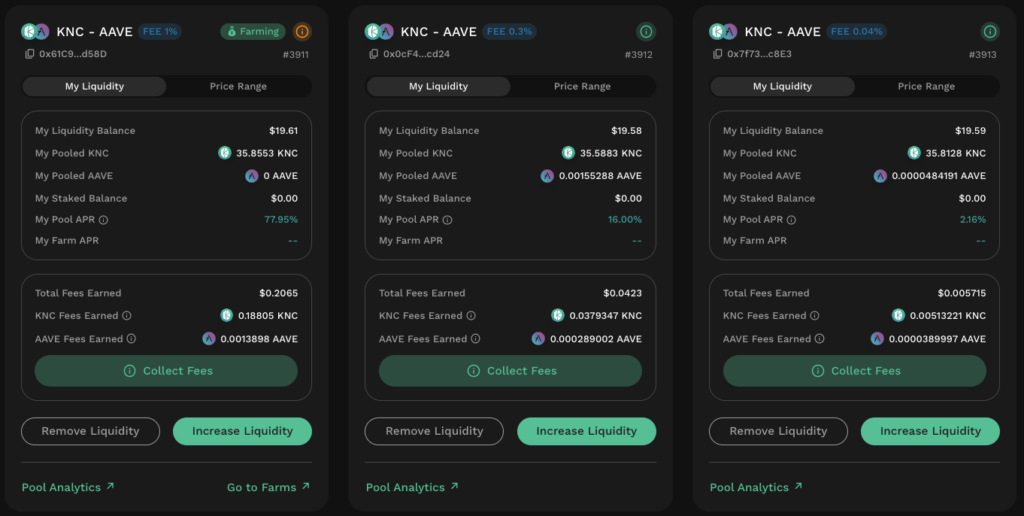
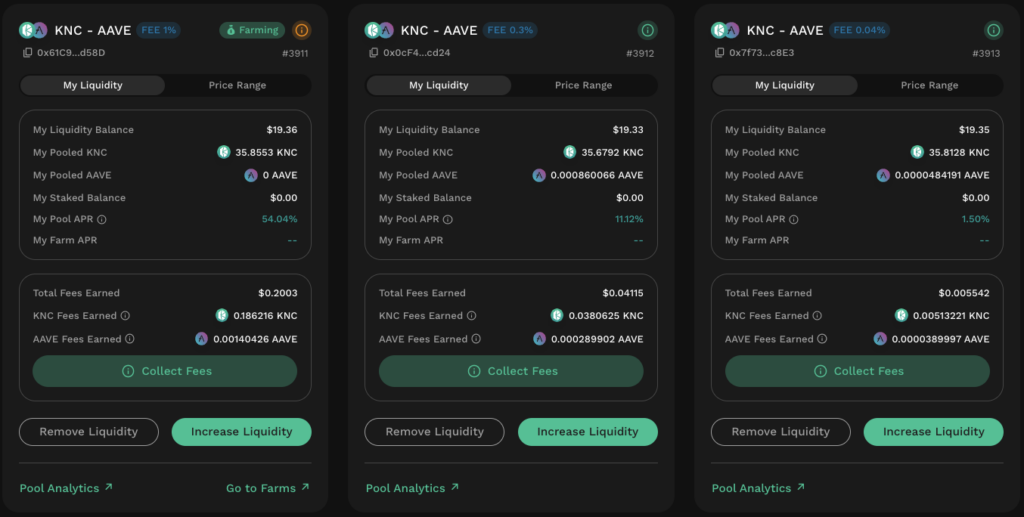
One thing that stands out for the KNC-AAVE pair is the trading volume consistency with trades only happening on day 1 and 2. While there were no fees generated from day 3 onwards, notice that the USD balance for each position tracked each other very closely. This points to the fact that the large majority of smaller cap tokens tend to move in tandem with the wider market. Consequently, prices tend to move more aggressively when a token-specific factor emerges.
As expected, the impermanent loss risks were also made permanent for the observation period as the market moved in a single direction only. In such cases, higher fee tiers are able to offset some of the impermanent loss faced by LPs.
Given that the trading happens in spurts and the amplitude of the swing tends to be significant, LPs will be better off providing liquidity to higher fee tier pools. Interestingly, in cases where prices never recovers, higher fee tier positions can also function as a gradual buy/sell strategy with the added benefit of trading fees.
Conclusion
What this analysis has shown is that to get the best APRs, the fee tier selected must take into account the market correlation for the token pair being provided. Moreover, the expected market trading range will also be highly dependent on the liquidity provision duration selected.
For a lower fee tier pool to outperform a high fee tier pool, it must have generated a trade volume that is [highFeeTier%/lowFeeTier%] times more than the high fee tier pool. This is more likely to happen for highly active trading pairs which tend to trade within narrower ranges during times of calm. In other words, lower fee tiers pools are better suited for more correlated token pairs where the price tends to oscillate frequently within a narrower range.
For token pairs where trades tend to be sporadic, higher fee tier pools will offset the opportunity cost of liquidity contribution. Critically, such token pairs also tend to have more constrained liquidity resulting in more extreme swings. In such cases, higher fee tier pools are also able to significantly offset the impermanent loss risks.
Ultimately, the best fee tier is highly specific to the token pair being provided. In general, LPs should look at the historical correlation between the tokens and note the frequency as well as the trading price range. If the token pair consistently trades within a narrower range, lower fee tiers are recommended. The fee tier selected must scale according to the proportion of trades that happen in times of relative calm versus in times of heightened market volatility.